Every data point, every metric made simple in our report templates.

The Hub Planner report engine is very powerful and allows you to create simple and intuitive reports to aggregate all the data across all teams and projects.

users love us 1
medal 1
ProjectPortfolioProgramManagement HighPerformer HighPerformer
ResourceManagement HighestUserAdoption Small Business Adoption
TimeTracking HighPerformer Mid Market HighPerformer
Hub Planner Reports Hero 1 1

Smart Report Templates for the Entire Team To Use.

  • Intuitive Report builder allows you to generate unlimited combinations.

  • Built in filters allow you to get to the data quickly.

  • Add 100’s of columns to any report.

  • Save reports as custom to save time

  • Heat map reports to visualize data quickly

  • Save and export reports simply

Create efficient and quality reports with the intuitive smart Reports home base. The responsive interface is a well balanced grid layout with distinctive easy to identify icons which leads to report templates.

Key features of Hub Planner Reporting

Resource mgmt

Utilization Reports

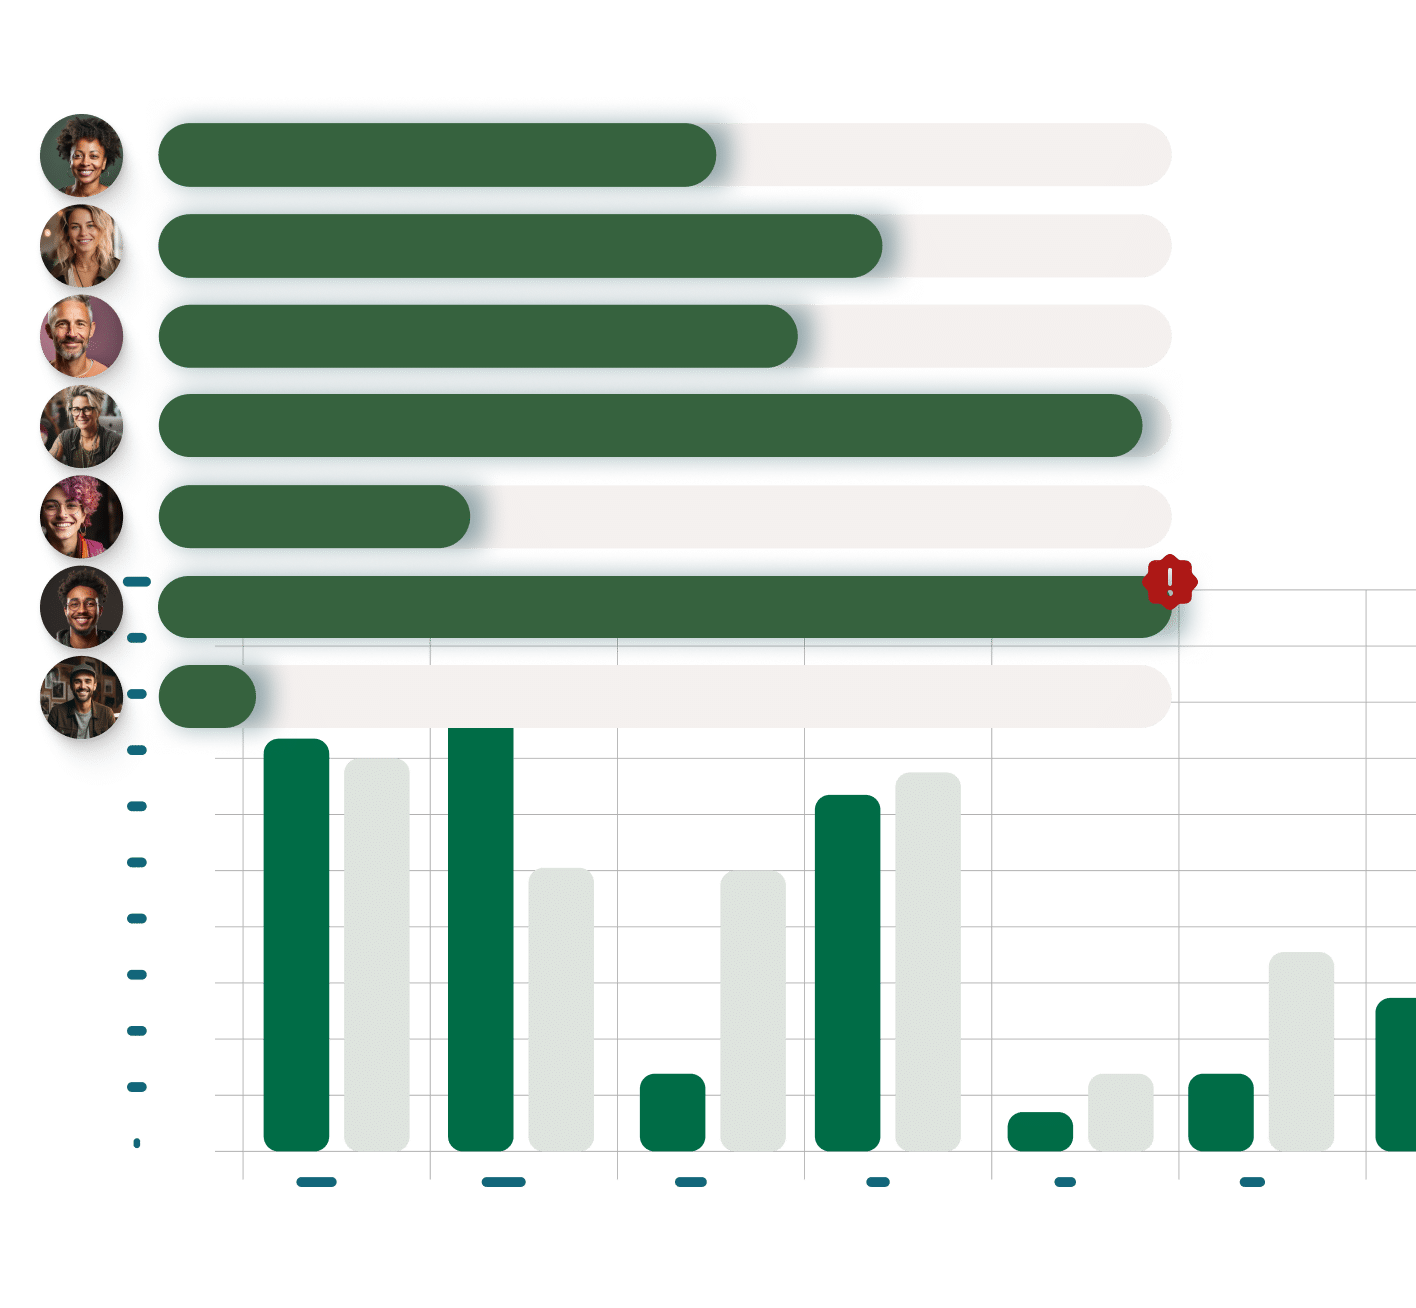
Quickly see with heat maps where the gaps are in your teams utilization.

ArrowsIn

Spend Tracking

Track project spend and resource spend so you clearly see where the money is going.

Timesheets

Report Generation Builder

Simply build and create reports with our custom builder.

PresentationChart

Share and Save Reports

Save reports internally or just for yourself to view later.

Invoice

Conditional Formatting

Use conditional formatting to highlight key numbers if a report.

TreePalm

Budget & Profitability

Generate reports to track budget and profitability across all projects.

What our clients are saying.

 The TOIL feature integrates well into our workflow, allowing for crucial downtime after peak project periods.

“Intense projects and overtime are a regular part of our work, often driven by the fast-paced nature of our industry. Time off in lieu compensates for these demanding periods, and with Hub Planner adding the TOIL feature, this becomes seamlessly integrated with the rest of our resource management. It brings balance and boosts flexibility, helping us and our employees efficiently recharge after demanding periods.”

image 86Peter Scott, Managing Director @Cityscape

Easy to use

Report Builder

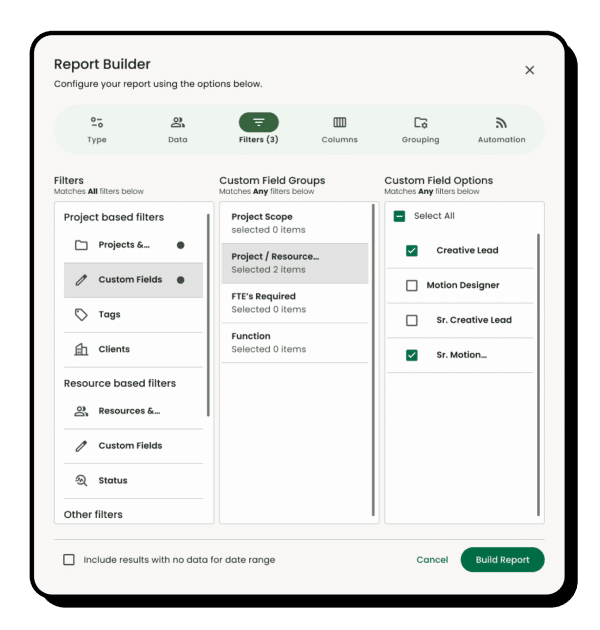
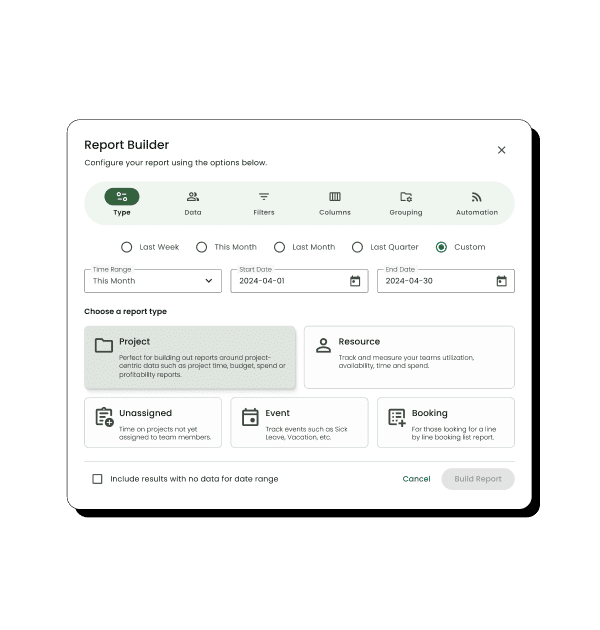
Define the applicable criteria necessary and begin design. Select your report type followed by selecting the required report data metrics. There are 100’s of filter and column report options for you to choose from. Configure columns with a smart drag and drop facility to determine your report layout. This gives you maximum flexibility.
Hub Planner Reports Report Builder

Fast Real Time

Reporting

Reports are produced in real time with smart caching to optimize speed, providing powerful instant insights into Projects, Resources, Utilization, Spend and Budgets. Real time report information allows for making smarter and strategic decisions in future planning and forecasting.
IT Consultancy Reports Hub Planner 1

Hub Planner Reports FAQ

Hub Planner’s powerful report engine enables you to create a wide range of reports, from simple and intuitive to complex, that aggregate data across all resources and projects. You can use our pre-built templates or the report builder to create custom reports incorporating projects, resources, events, and unassigned work. Enhance your reports with charts and graphs, download them as Excel or CSV files, and easily share them with your team.

The report builder allows you to generate various combinations of reports through a user-friendly interface. You can add and update various columns, create filters, select data, group information, and choose a date range to tailor your reports precisely to your needs.

We have pre-designed templates that your team can use to generate consistent and comprehensive reports. These templates cover various areas, including projects, resources, billing and spending, utilization, clients, heat maps, and unassigned work.

Heat map reports visualize data quickly, helping you to easily identify patterns and gaps in your team’s utilization.

You can add all the columns you need to any report, allowing for detailed and comprehensive data analysis.

Our dashboards provide a clear view of your budget, project schedule spend, and reported spend when you are using the billing rate and timesheet extensions. Additionally, you can generate billing and spend reports to monitor budget and profitability across all projects and resources, offering valuable insights for financial management.

Explore more of Hub Planner

All the features you need to manage your resources and drive successful projects.

Resource mgmt

Resource Management

Streamline team scheduling and gain instant visibility into availability and utilization for efficient planning.

Timesheets

Timesheets

Measure the actual time reported via timesheets versus the forecasted time through the resource scheduler.

PresentationChart

Dashboards and reports

Grasp performance, project costs, profitability, and team utilization in a comprehensive overview.

Project mgmt

Project management

Manage project spend, change resource rates, internal costs, profitability, and project budgets.

Capacity Planning symbol 1

Capacity planning

Save time scrolling through entire teams and quickly narrow down your team by availability or utilization levels.

TreePalm

Vacation & PTO

Handle team vacations and PTO with ease via the scheduler—request, allocate, and track leave with full reporting capabilities

Done with complicated software & spreadsheets?

Experience Hub Planner for yourself.