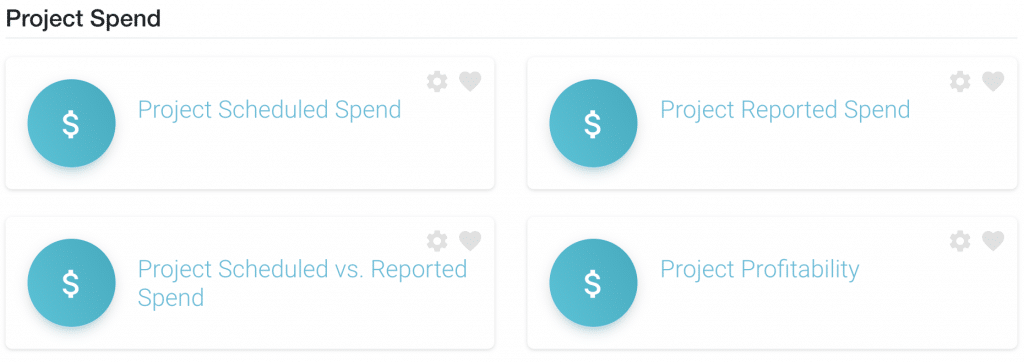
Reports by Project Spend
We are going to look at the project report templates for identifying scheduled and reported project spend. The scope of project spend contains one of most popular reports, Scheduled verses Reported Spend. These reports really encompasses the real time data to illustrate where the project stands. All time that has been spent on the project will need to have been reported via Timesheets. By doing so, you have an up to date realistic view of your project spend.
The project billing panel within the scheduler provides a birds eye view of where the project stands in terms of budget scheduled and actuals.
How much budget had you allocated initially? How much of the budget have we spent so far? Where are you now? Are we on target? I need to see a breakdown of how much was spent so far. These are all questions that many Project Managers have been asked. Many Finance Directors need to see or your Stakeholders want to know. Other questions such as, how much profit are we set to make at this point? By reviewing such reports will indicate a view of profit due. Perhaps there may be scope to lengthen the ‘Development’ phase by two weeks. On the other hand, this may mean you need to cut short the ‘Development’ phase by two weeks!
Scheduled Spend
How much are we scheduled to spend on this project? Are we on track? A couple of clicks and you have an over all view of where all of your projects stand financially. Invaluable.
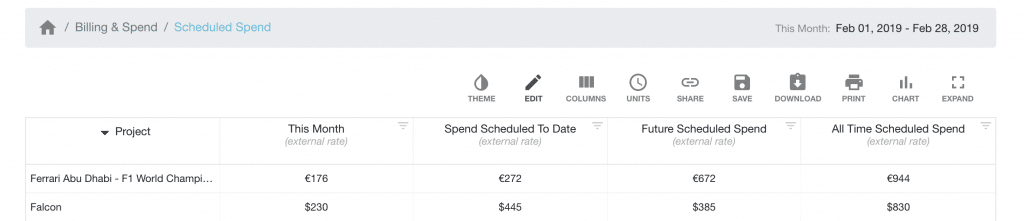
The scheduled spend report allows you to view your list of Active Projects by default and what they are each scheduled to have spent or due to spend. The date range allows you to choose various options that you can compare against in the first column. After that, you will have 3 subsequent columns that will detail how much you have scheduled to have spent to date, how much you are scheduled to spend in the future and the combined total of the previous and future forecasted spend.
All figures are based on the external rate. Should you wish to obtain the same report based on internal figures you can simply do so by altering the filters. Additionally, you can opt to save the report for a future template.
Reported Spend
Reported spend works hand in hand with scheduled spend. Metrics are the same, however the type of spend is Reported meaning that resources have submitted their hours worked on a project via Timesheets. These are your actuals.
Pick a date range and compare against reported spend to date, reported future spend and indeed total reported spend. Furthermore, delve into each project for a more detailed analysis of where funds originated from. Here you will immerse yourself into each resource reported spend for each project.
What are the data sources used?
Take a look at the table below. Note that all figures are based on the external project rate.
| Resource = Billable | Resource = Non-Billable | |
|---|---|---|
| Project = Billable | Booking = Billable | Booking = Non-Billable |
| Project = Non-Billable | Booking = Non-Billable | Booking = Non-Billable |
Scheduled vs Reported Spend
Projected spend verses actual spend. Compare and contrast the difference in what you had scheduled to spend on the project verses what was actually reported to spend.
Project Profit
What’s the bottom line looking like? View profits per project. The great thing about these reports is that you can create this report at any time of the project. So, should you see that your project hit a little road bump, you can make strategic decisions to realign and optimize profit.
Filters and Customization of Project Spend Reports
How do I see Pending Projects or my Customized Project Groups?
By default, the setting is set to Active Projects. However, should you wish to view Pending, Floating, Planned, Archived or whichever customized project groups you have. You can easily do so by following these steps:
- From the above screen click on EDIT
- The REPORT BUILDER modal will appear defaulting to the SELECT DATA tab.
- On the left hand side are the list of PROJECT GROUPS available to select.
- Simply click on the desired groups and click GENERATE
- Now the report will show the new data you have selected.
Can I view spend from just one specific project?
Indeed you can. Similar to the previous question on viewing more Project Groups. When you select a group from SELECT DATA, all projects associated with that group will automatically be selected. Should you wish to view a specific one, by clicking on the the Project Group again will unselect the projects. A quick way of finding a particular project amongst many is to use the SEARCH field located at the top of the project list. Alternatively, you can scroll through the list of projects and click and choose projects you wish to include in your report as you scroll.
Tip: Use the search field to quickly identify a project
I want to compare project spend from 5 projects, but they are from two different project groups?
That’s no problem and easily solved. Following on from the first 3 steps of ‘How do I see Pending Project Spend or from my Customized Project Groups?’
- Select the Project Groups you that contain the projects you wish to view
- Corresponding projects will automatically be selected on the Projects column. If there are too many within that group, I suggest you search for the 5 projects you are looking for.
- Scroll through the projects and unselect any that you do not wish to appear in your report.
- Click GENERATE
- Now the report will show the project spend from the 5 projects you have selected.
How do I change the date range to view this quarter?
There are a number of options pre configured into the date range options. Ranging from week, month, quarter and year. The options quickly provide you with access to THIS WEEK, LAST WEEK and NEXT WEEK options as soon as you click on the date range. You can access this direct from the REPORT BUILDER or the initial returned data report. Indeed, you can select from the various options or create a customized date range by selecting from the calendar.
- Click the date range located to the right above the report toolbar.
- From the drop down list, select ‘This Quarter’
- Click Apply and your report should return with scheduled spend for this quarter
Can I view scheduled spend on a project between specific dates?
A great question! And easy to produce. All you need to do is click the date range and choose your starting and finish dates. Followed by clicking ‘Apply’. But, let’s take this from the top on how to get through the previous steps.
- From the Reports Home Page click on the Billing & Spend folder.
- Click on ‘Project Spend’ which is the very first folder.
- Returned data will appear. If the project is located within another folder, follow the steps from ‘How do I see Pending Project Spend or from my Customized Project Groups?’ to generate the report for your project.
- Click the date range located above the report toolbar.
- Choose your starting date, finish date and click apply.
Can I view Scheduled Spend on Projects with a Booking Category or Custom Field?
Absolutely! By utilizing the filters on the REPORT BUILDER allows you to customize your report as you wish. There are many FILTER options available to you including by: CLIENTS, PROJECT MANAGER, DATA OPTIONS, PROJECT TAGS to name but a few. To access all you need to do is click on EDIT to bring up the REPORT BUILDER. From here, select the 3rd tab entitled FILTERS. Subsequently, select the data you wish to access on the left hand column. Lastly, click GENERATE.
Further Reading
- Reports Feature Page
- Reports Press Release Blog Post