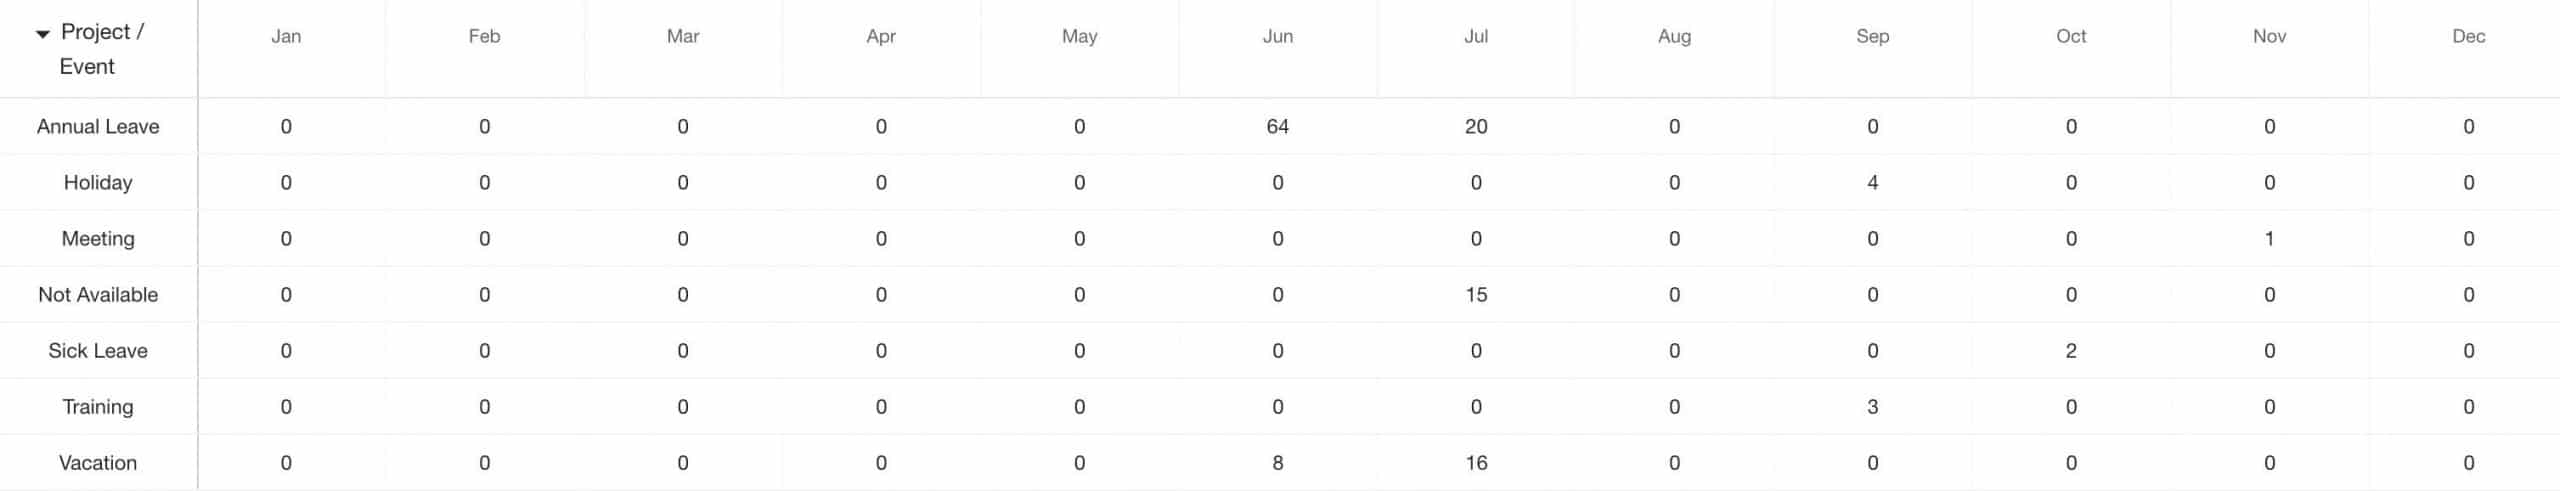
Heat Map Report of Events
Open Reports Folder
- Reports
- Heat Map Reports
- Events
- Choose Template
- Alter Date Range as necessary
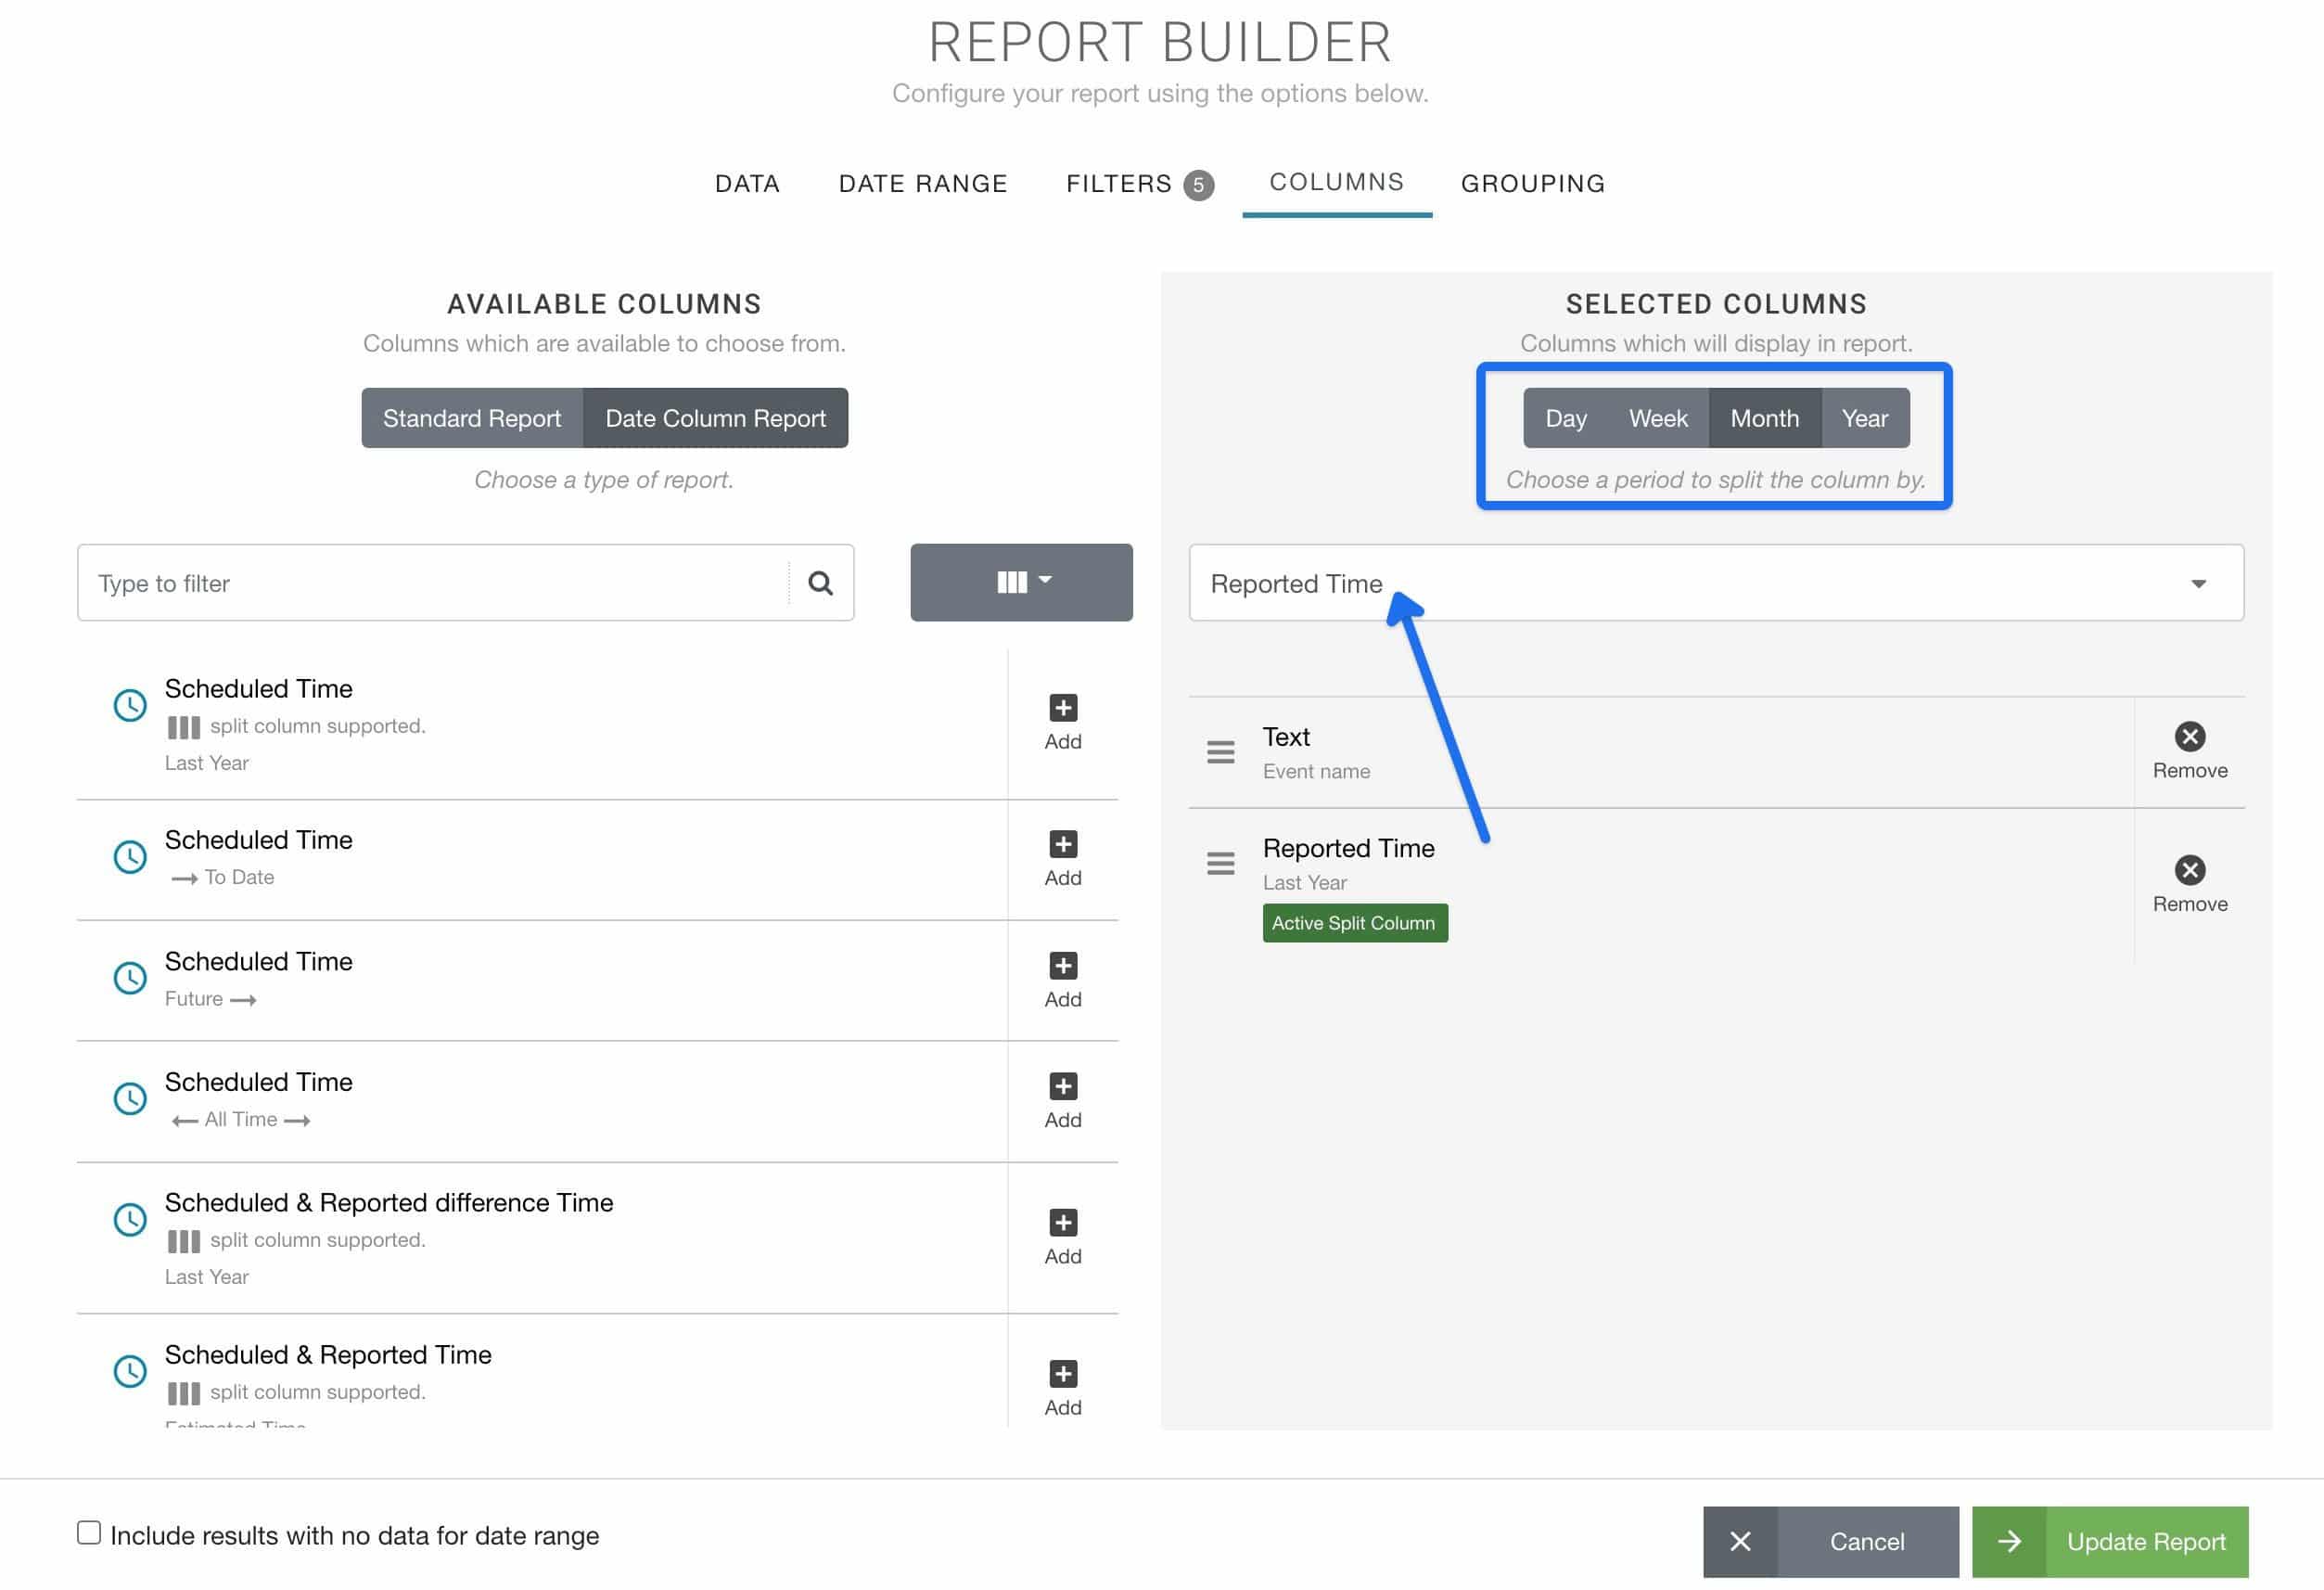
To alter the frequency go to
We can adjust how we show the data in terms of the dates. By default, the report will show us a daily breakdown of the data over the current month. We can adjust that to show is a weekly breakdown instead. Options include Daily, Weekly, Monthly and Yearly. It’s handy to adjust the date range to view more data. In this example we will adjust from daily to monthly so that we can view the 12 months of the year on the one page.
- Edit
- Columns
- Choose desired frequency (Day / Week / Month etc)
- Update Report
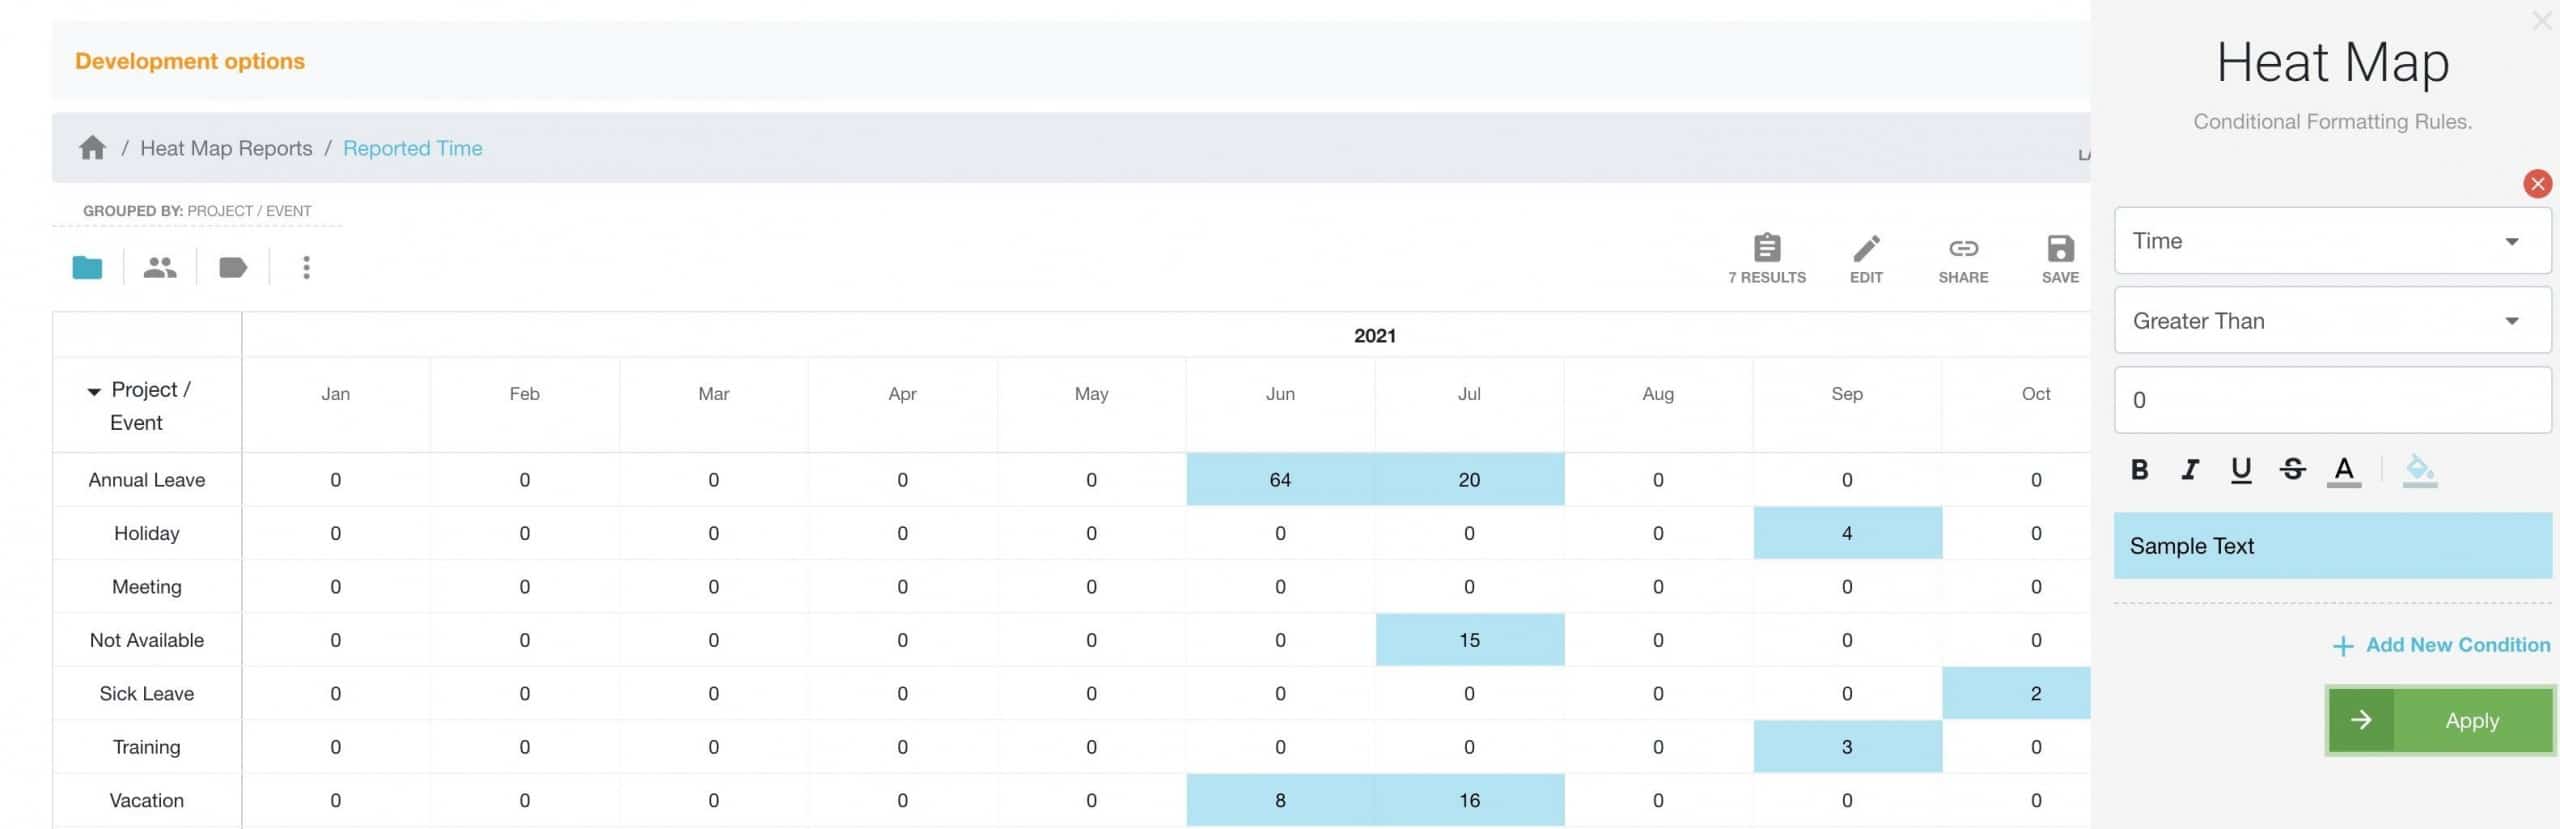
To add Conditional formatting
Conditional formatting can be super helpful in highlighting important data in a report. We can add multiple conditions to the reports see below for steps on how to add to your report.
- Report Toolbar
- Options
- Conditional Formatting
- Apply rules as necessary
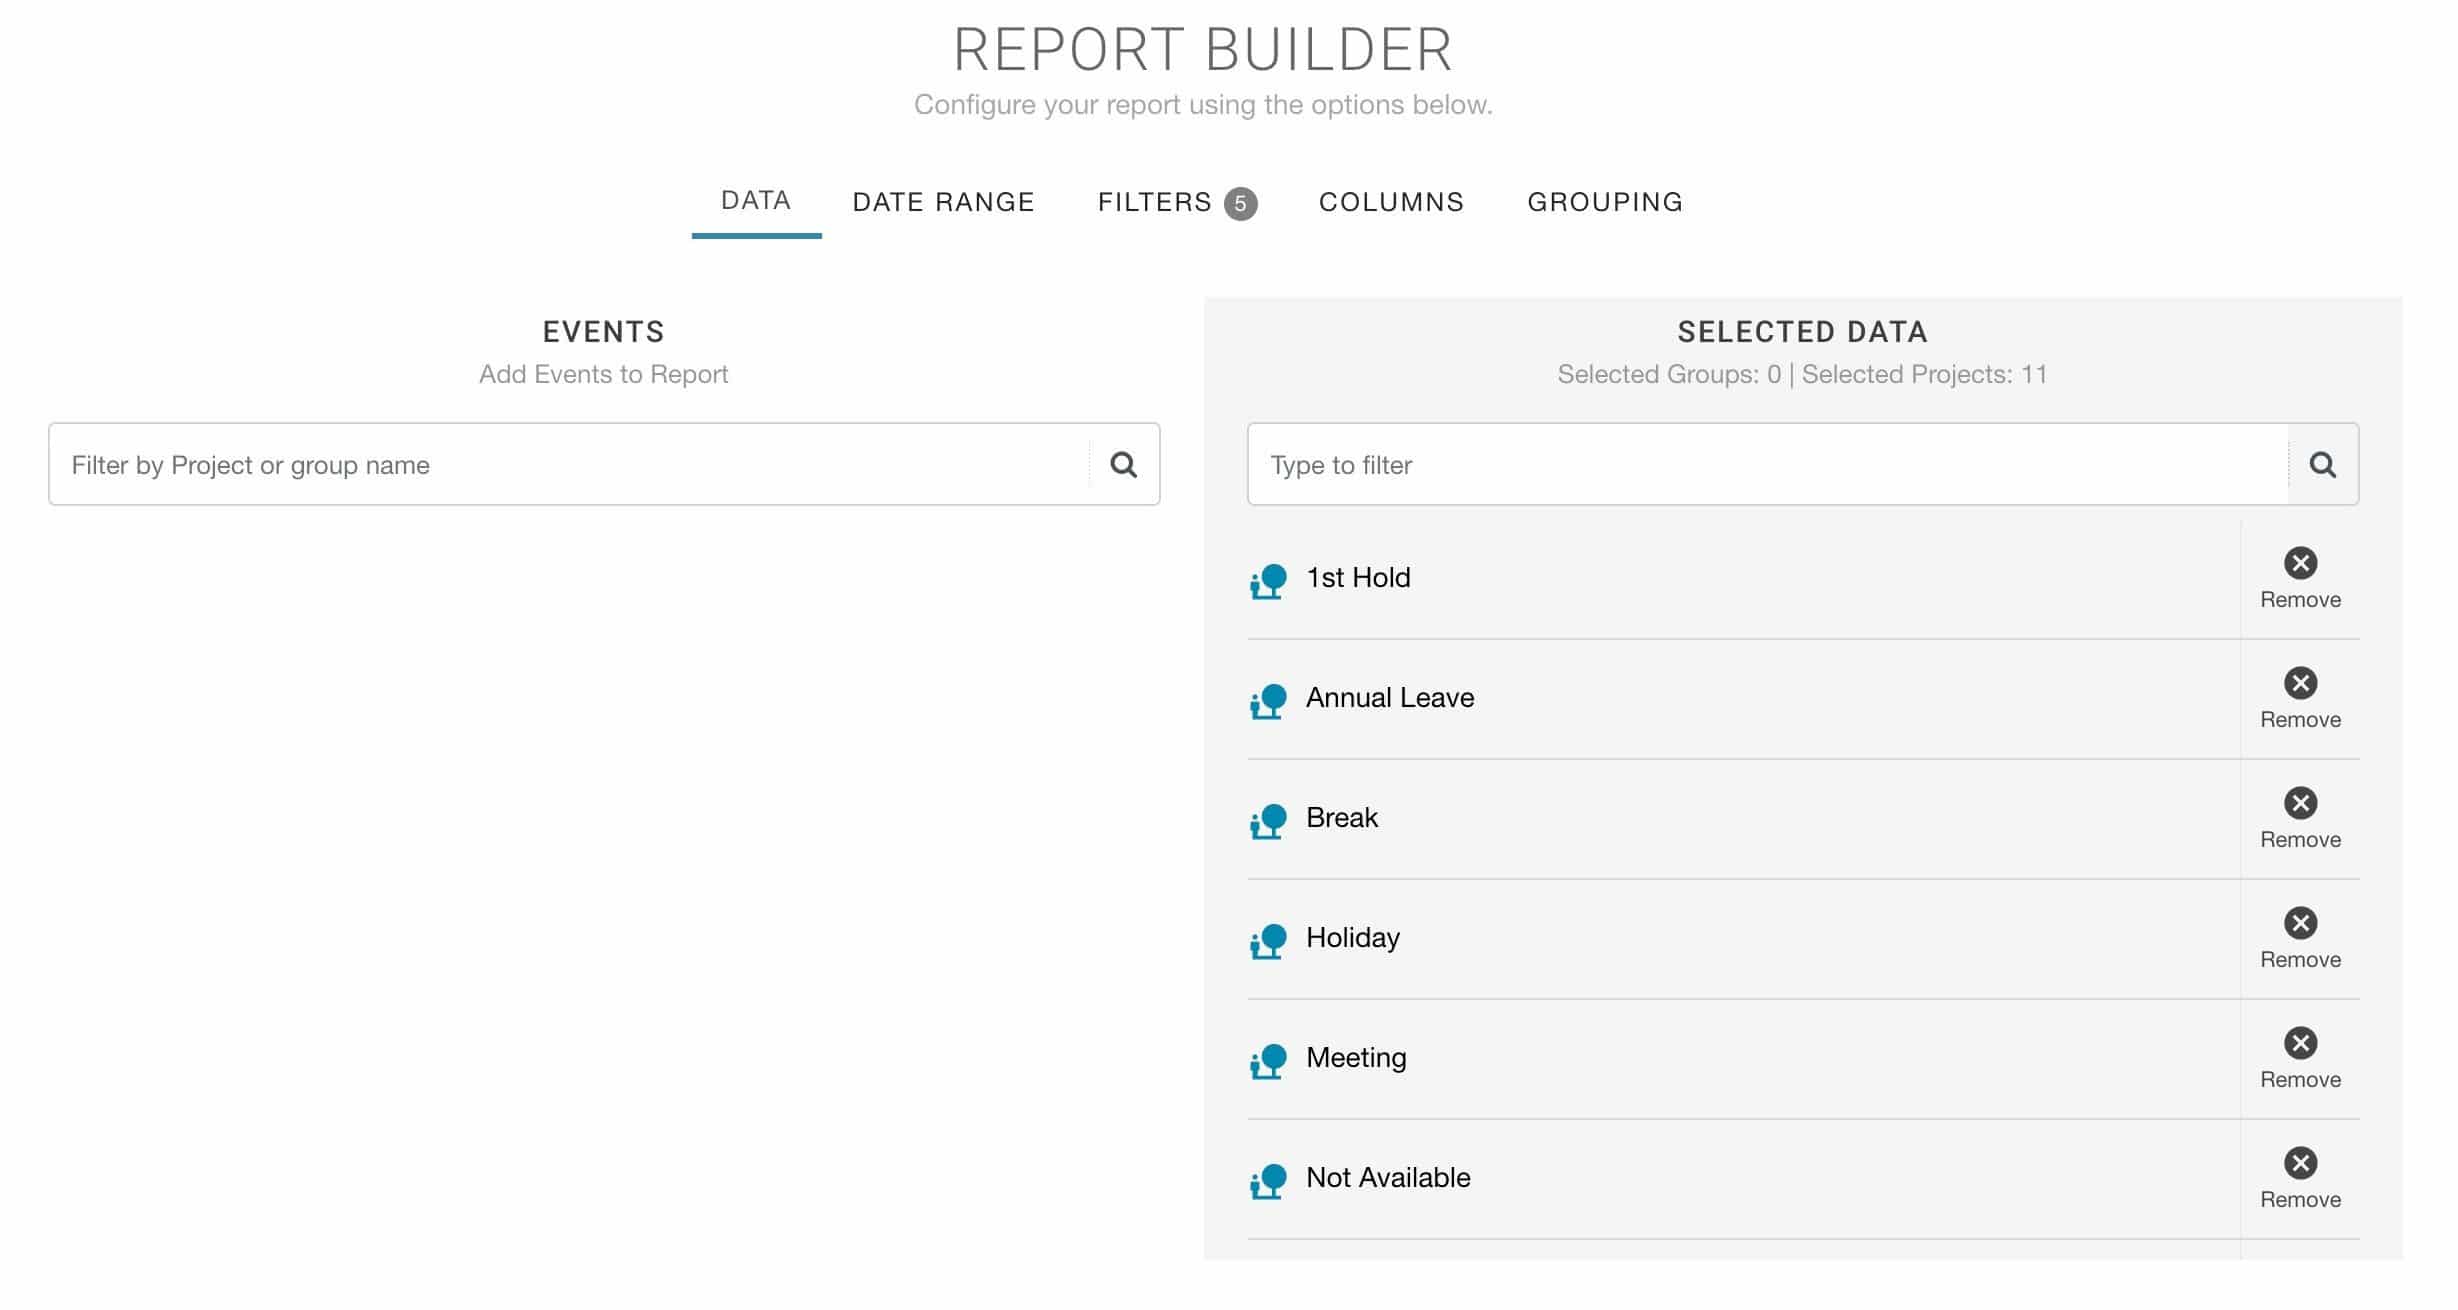
To alter the events you report on:
Perhaps you want to filter to just view Annual Leave or Sick Leave in the report. You can do this via the data tab in the report builder.
- Report Toolbar
- Edit
- Data
- Select what Events you wish to report on
- Update Report
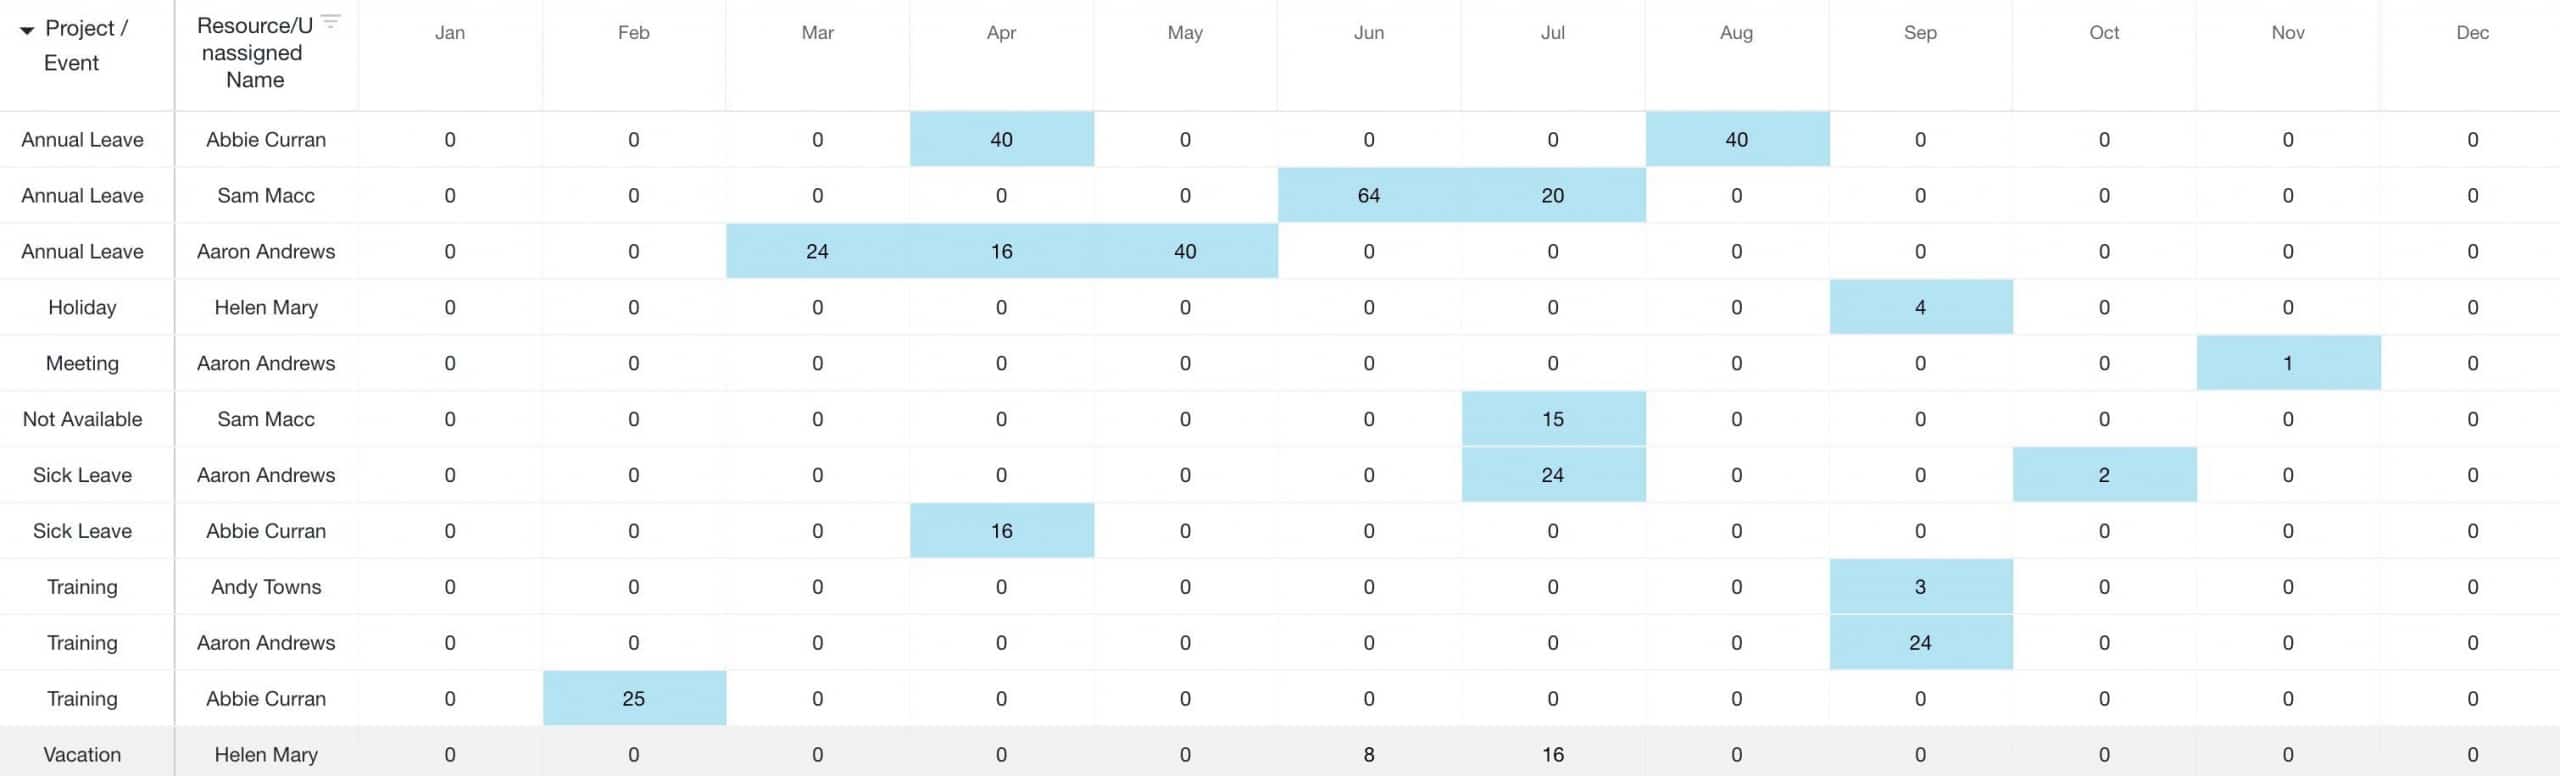
Dig deeper and show breakdown of Event to Resource
By adding a secondary grouping will allow us to breakout the data even more. Our primary grouping will be the event, and the secondary grouping will be the resources. This means that we see each event broken out by resource and their individual time against the event.
- Report Toolbar
- Edit
- Grouping
- Add Secondary Grouping to Resource/Unassigned
- Update Report
Now you have a breakdown of resources and events.
Save for Future
Suggest that you save this report for future reference. Saves you having to repeat the process each time. The date range will update accordingly. When it comes to saving a report, there are two options available. You can save privately or internally. Privately will save to My Saved Reports folder, and saving internally will save to the Internal Reports folder. To do so:
- Click ‘Save’ within the Report Toolbar.
- Opt to save to your own folder ‘My Reports’ or alternatively save within ‘Internal Reports’ which gives all colleagues access to this report.