Before we start, there are Timesheet reports available within the Timesheet modal. But what we will show you here, is how to create a customized timesheet report for your own team on your on requirements.
The Report Builder
First things first, let us quickly take you through the tabs of the Report Builder. What is it? Using the report builder we can create customized reports based on our own requirements. This allows to either adjust existing templates or create our own from scratch. There are a 6 tabs or sections within the report builder. Each has their own function:
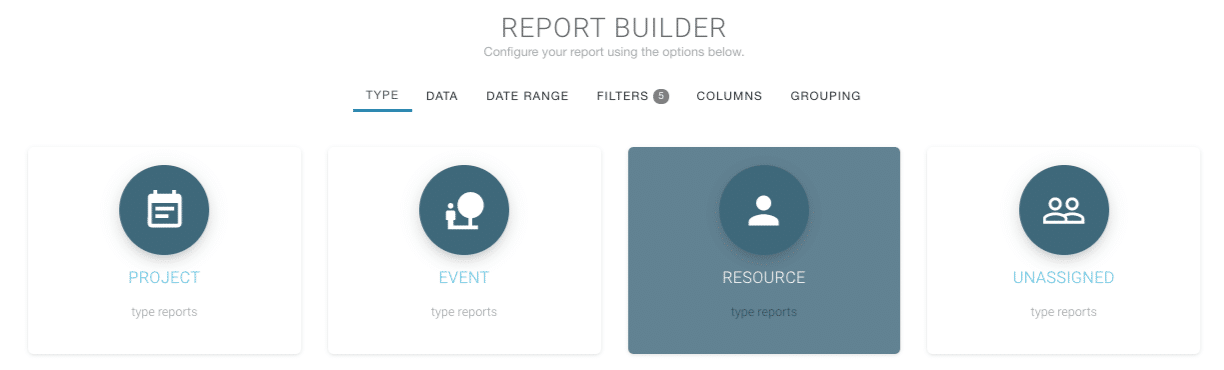
- Type: What type of report is it? Project, Event, Resource or Unassigned? You choose one. For timesheets, we will choose Resource.
- Date Range: Defaulted to this month. Adjust as necessary from the drop down list or custom select.
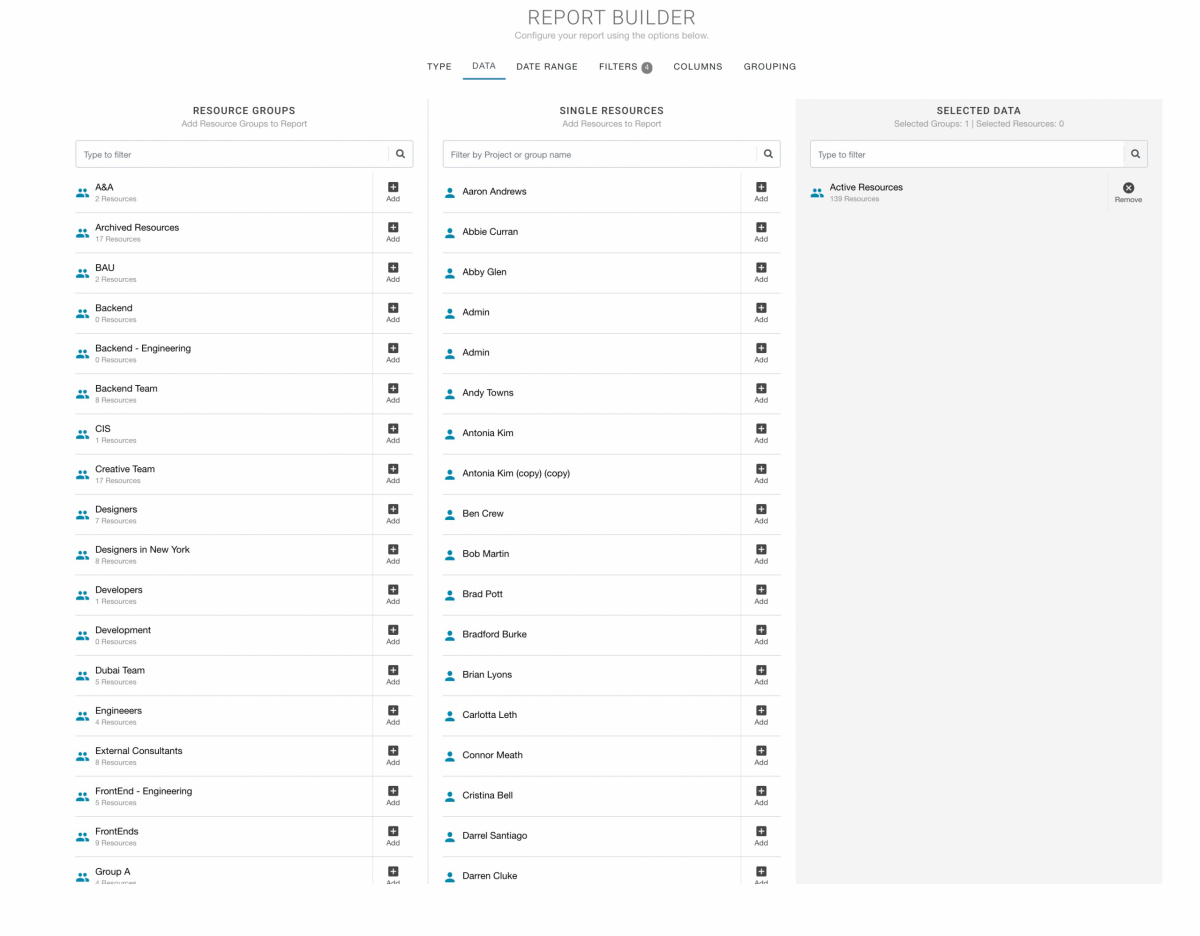
- Data: What are you reporting on? All resources or a select group? All Projects or a specific project group etc. Adjust as necessary. For us choosing a resource Type of report, the default is Active Resources.
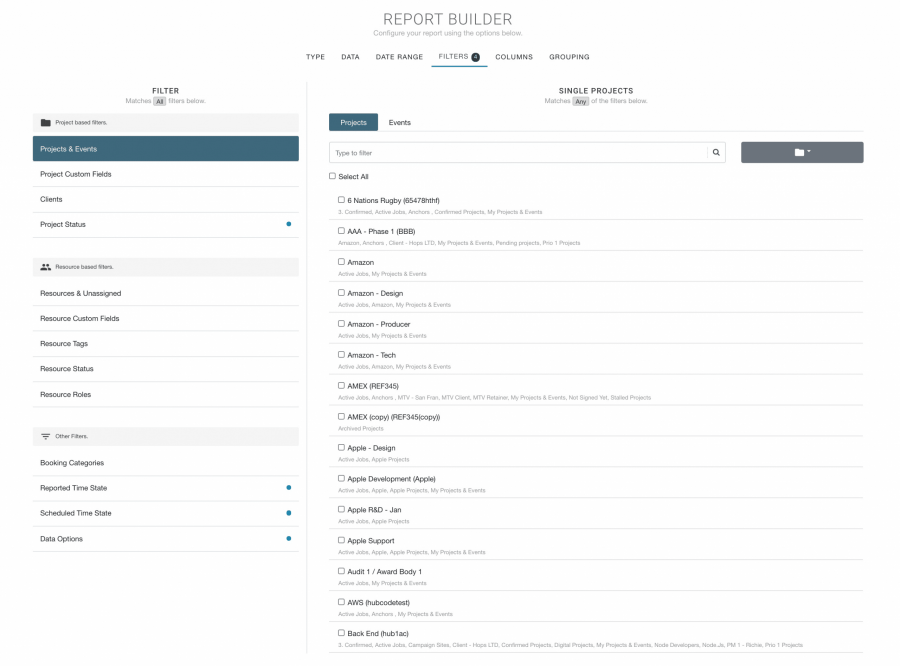
- Filters: There will be a natural default to filters already applied depending on the Report Type. Again, adjust as necessary.
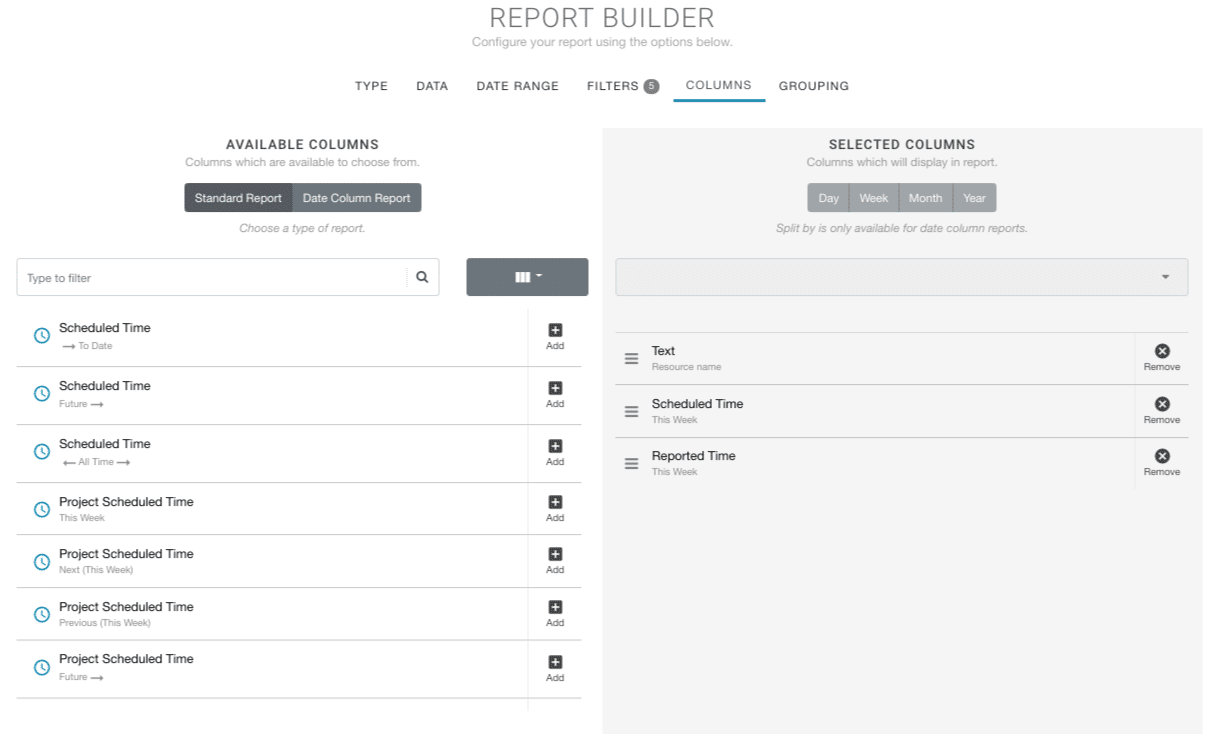
- Columns: This is the main body of the report. What data columns do you want to see.
- Grouping: Here, grouping allows us to sort/filter/display the results according to project / custom field / resource or you can choose to complete ungroup results and obtain the raw data.
Create Customized Reports:
It’s so easy to create a customized report based on your own data requirements. You might want to capture more details like time notes, or spending costs along with the timesheet reported time. Here are a couple of scenarios for you:
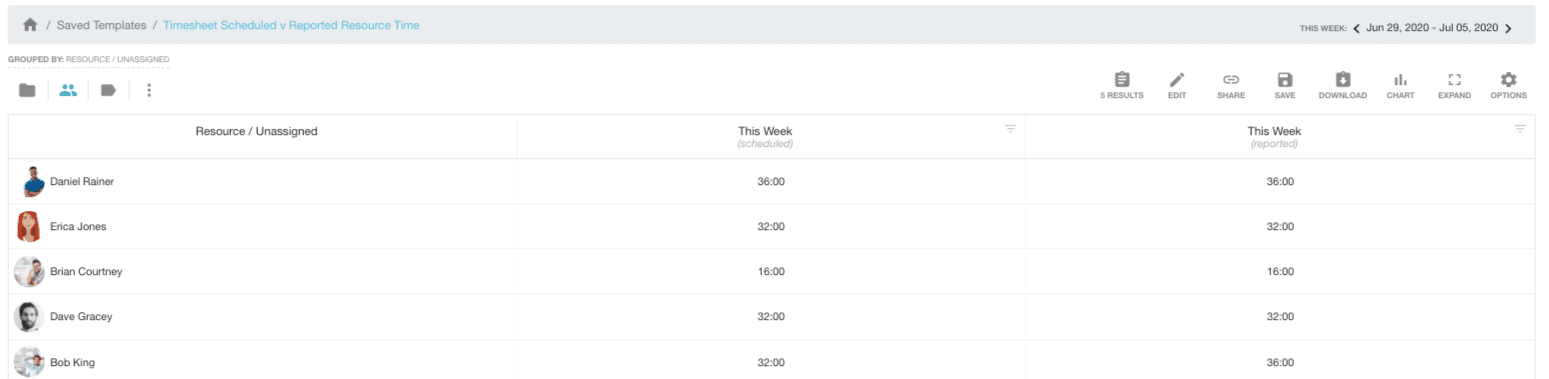
Example 1 – Basic, Weekly Scheduled v Reported Timesheet for all Resources.
| Report Builder | Selected Data |
|---|---|
| Type | Resource |
| Data | Active Resources |
| Date Range | This Week |
| Filters | N/A |
| Columns | Resource Name Scheduled Time Reported Time |
| Grouping | Resource/Unassigned |
Timesheet Report Builder: Type
What type of report is it? Project, Event, Resource or Unassigned? You choose one. For timesheets, we will choose Resource. Picking so will determine what we will see in the next tab, Data.
Timesheet Report Builder: Date Range
Date range is defaulted to this month. Adjust as necessary from the drop down list of pre-formatted options. Alternatively you can custom select the date range you need.

Timesheet Report Builder: Data
What are you reporting on? All resources or a select group? All Projects or a specific project group etc. Adjust as necessary. For us choosing a resource Type of report, the default is Active Resources.
Timesheet Report Builder: Filters
There will be a natural default to filters already applied depending on the Report Type. Again, adjust as necessary. You can opt to filter out certain projects if you have chosen a resource type report or even filter the custom fields or booking categories etc. The Filters section of the report builder really allows you to create a very detailed specific report. Filters are not always necessary, depending on the report you are looking for.
Timesheet Report Builder: Columns
Here’s what we want to capture in the Columns. This is the main body of the report. What data columns do you want to see in the report results?
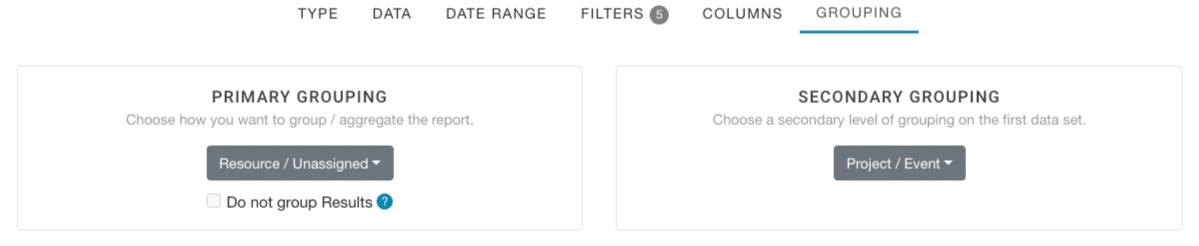
Timesheet Report Builder: Grouping
Hub Planner have created options for you to group the report by either a primary option or indeed include a secondary option too which will break out the report based on what you have chosen. Note, not all primary options will have a secondary option available.
You also have an option not to group the report results data. This will un group everything and provide you with a breakdown of raw line item data, day by day.
Build Timesheet Report Results:
What the report will look like? After building the report, we can now see a breakdown of the resources scheduled and reported time for the week. Next, we will save the report for future usage.
Save Timesheet Report
Once ready, click SAVE from the report toolbar. A popup will appear with two options. You can save either to Internal Reports where those whom have access to Internal Reports can view the content. Alternatively, you can save it privately whereby it will be accessible by you only in My Saved Reports folder.
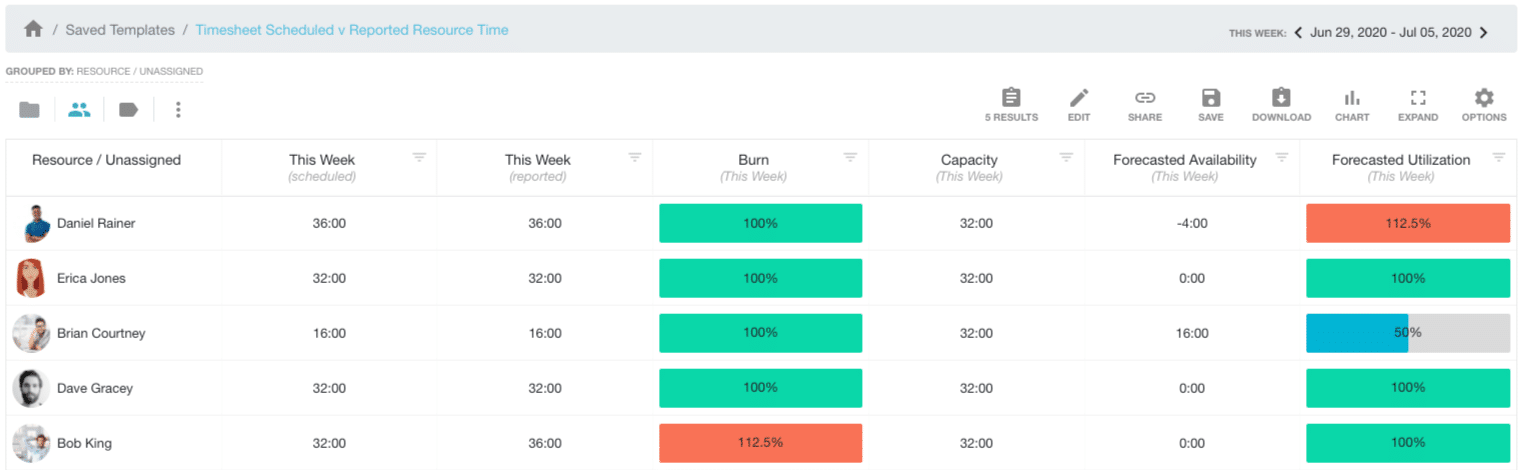
Example 2 – Full Resource Timesheet Report
Keeping in mind the step by steps shown in the example above. We will now add some more columns to the report. Everything else will remain the same.
| Report Builder | Selected Data |
|---|---|
| Type | Resource |
| Data | Active Resources |
| Date Range | This Week |
| Filters | N/A |
| Columns | Resource Name Scheduled Time Reported Time Burn Rate (Scheduled v Reported Time) Capacity of Resource Availability of Resource Utilization Rate of Resource |
| Grouping | Resource/Unassigned |
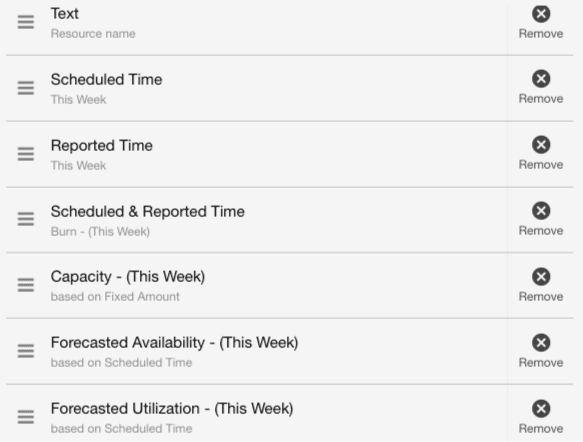
Columns
Here’s what we want to capture in the report results which we will add in the Columns section of the Report Builder:
- Resource Name
- Scheduled Time
- Reported Time
- Burn Rate (Scheduled v Reported Time)
- Capacity of Resource
- Availability of Resource
- Utilization Rate of Resource
Full Resource Timesheet Report Results
Example 3 – A Timesheet Heat Map of Resources Burn Rate
Scenario: Here’s what we want to capture: A heat map style report capturing scheduled v reported time by day and by resource and project. Again, we are not changing any other data except for what we want to see in the Columns / Report Results.
| Report Builder | Selected Data |
|---|---|
| Type | Resource |
| Data | Active Resources |
| Date Range | This Week |
| Filters | N/A |
| Columns | Resource Name Scheduled Time Reported Time Burn Rate (Scheduled v Reported Time) Capacity of Resource Availability of Resource Utilization Rate of Resource |
| Grouping | Resource/Unassigned |
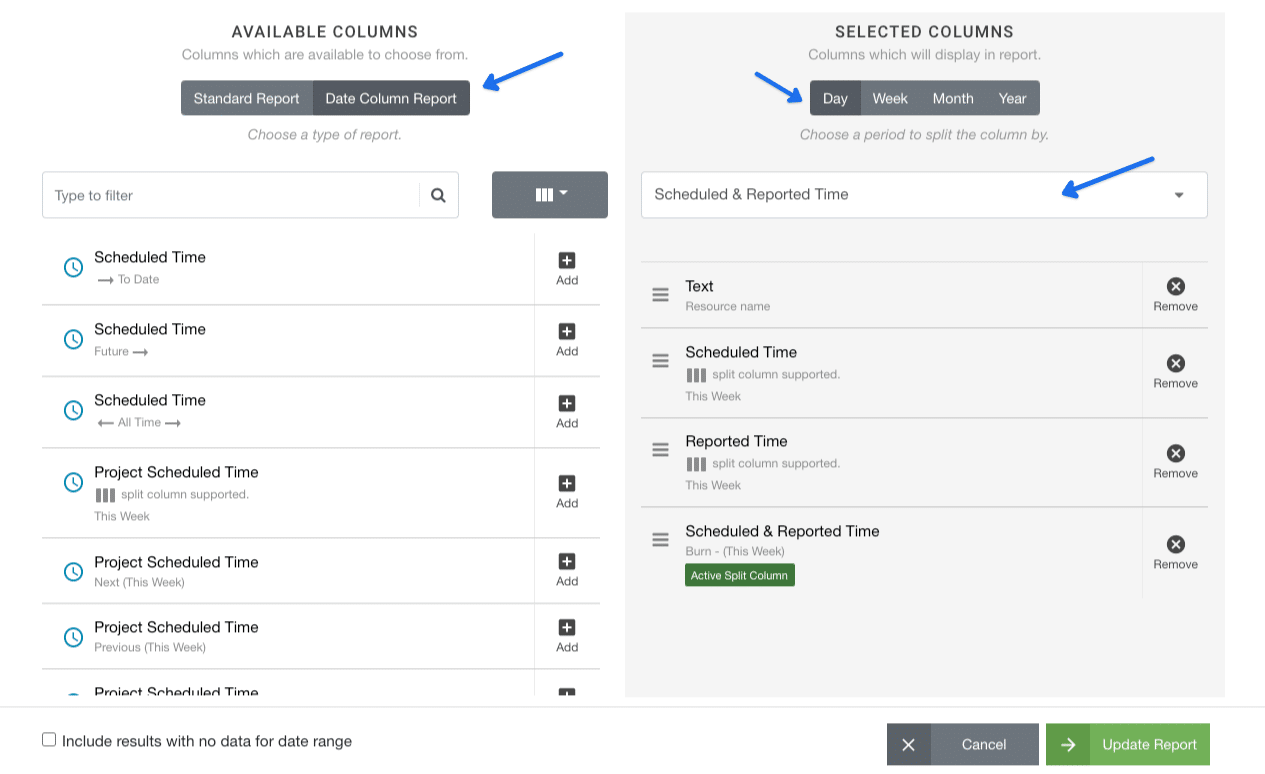
Date Column Report (Heat Map)
We are going to make a Date Column Report. A date column report allows us to create a split of the report results by a frequency like day, week, etc. This way we can see in a heat map style of where the time was spent. There are many column options that have the ability to turn into a date column report. However not all options will be available as some it’s impossible to split the results out, for example a text field.
To activate a date column report:
- Available Columns – Click ‘Date Column Report’
- Selected Columns – Choose the period to split the column by. Options include Day, Week, Month,
- If not already completed, add Columns for Report: below example:
- Resource Name
- Scheduled Time
- Reported Time
- Scheduled v Reported Time (Burn Rate)
- Select a column for the Date Column Report In the below example we have selected Scheduled v Reported Time (Burn Rate)
Grouping of Timesheet Report
- Primary Grouping is defaulted to Resource / Unassigned
- Secondary Grouping – select Project / Event.
- Click Update Report
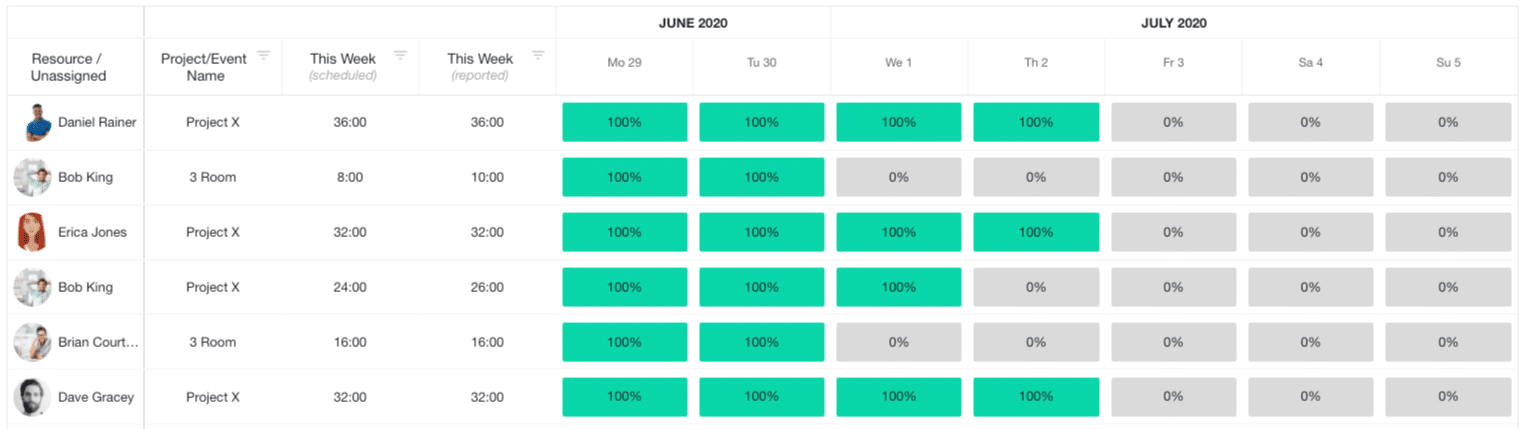
Heat Map Timesheet Report Results:
Now I have a burn rate heat map report grouped by resource and then project.
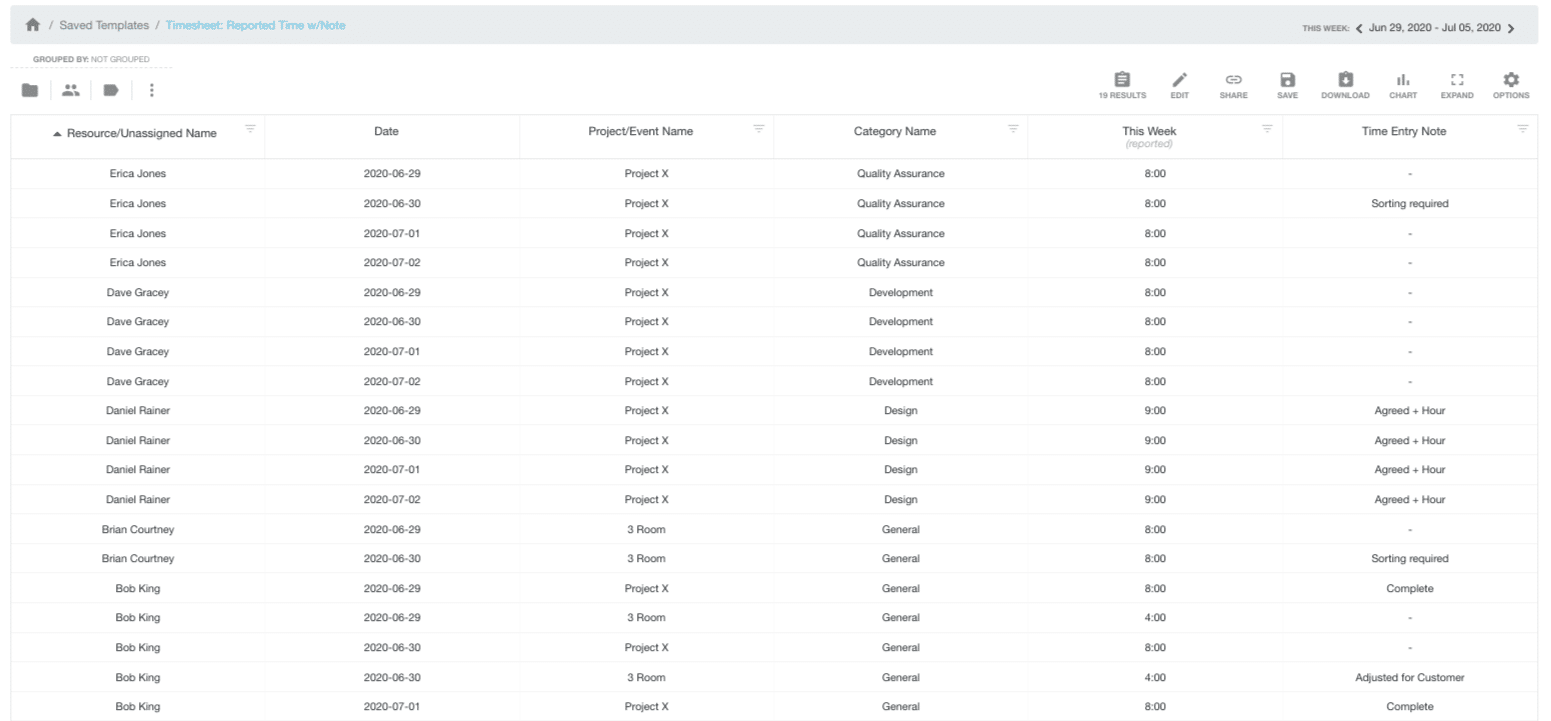
Example 4: Reported Time by Project + Notes
Scenario: You want a daily breakdown of Resource Reported Time by Project and any time entry notes.
Now, this is where we will go to Grouping tab and ungroup results. This means we get the raw line item data. We can then format as we want to. Continuing with the report above. All we need to is:
- Grouping Tab: Do not Group Results
- Columns Tab: Standard Report and adjust Column data as required.
| Report Builder | Selected Data |
|---|---|
| Type | Resource |
| Data | Active Resources |
| Date Range | This Week |
| Filters | N/A |
| Columns | Resource Name Scheduled Time Reported Time Burn Rate (Scheduled v Reported Time) Capacity of Resource Availability of Resource Utilization Rate of Resource |
| Grouping | Resource/Unassigned |
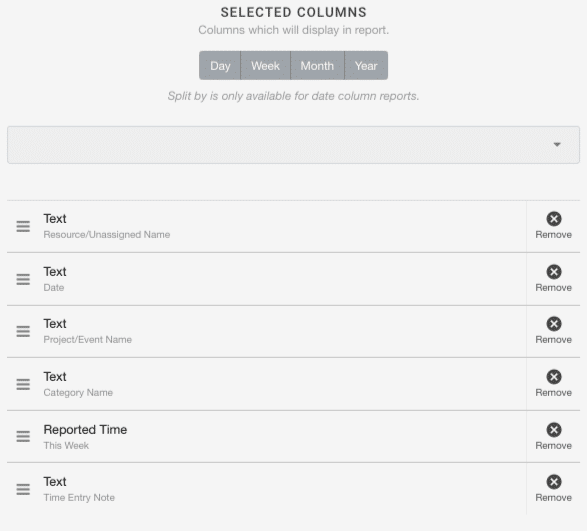
Selected Columns:
- Choose ‘Standard Report’
- Add Selected Columns as seen
- Resource Name
- Date
- Project Name
- Booking Category
- Reported Time
- Time Entry Note
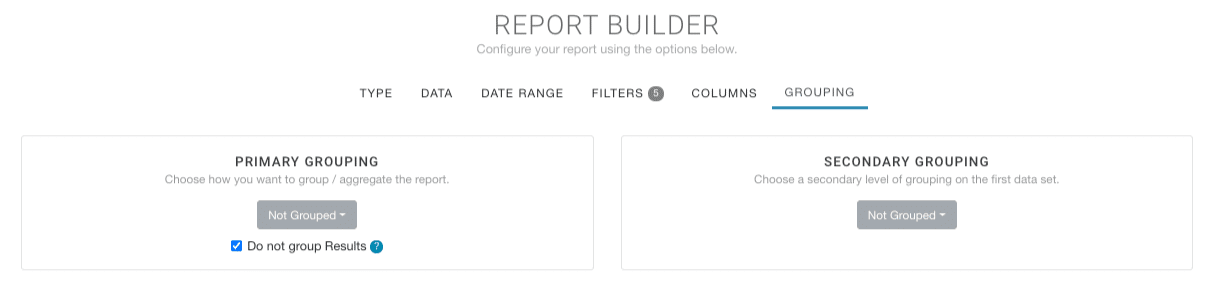
Grouping Report Results
- In Primary Grouping, click ‘Do not Group Results’.
- Click the green button ‘Update’ or ‘Build’ to produce the report.
Timesheet Report Results
What the report will look like: Feel free to sort, filter. Indeed, use the Report Toolbar to ave, expand, chart, apply conditional formatting, etc. For more help on the Report Toolbar, check out some other helpful articles within the Knowledge Base. Click here for more help on using the grouping tab and ungrouping results.
More Helpful Articles?
Heat Maps Reporting for Resource Management
Improve Resource Teams Capacity Planning with Heat Map Reports
How to use the Report Toolbar and Report Builder
New Update to Double Grouping: by Custom Fields with Heat Map Report support
Build & Download Entire Project Report Resource Bookings