What is a Heat Map Reporting?
Heat Maps reporting provide a visual breakdown of data making it easier for the user to identify key information and highlight important data. Hub Planner encompasses a number of heat map report templates of projects, resources, events and unassigned work. The breakdown is usually defaulted by each day based on the current month. Multiple formatting options are available for a more in-depth focused or an expansive view of data. Each heat map reporting template helps to focus on important information relating to the progress of projects, budgets, resource capacity and utilization.
A heat map is a graphical representation of data where the individual values contained in a matrix are represented as colors. “Heat map” is a newer term but shading matrices have existed for over a century. – Wikipedia
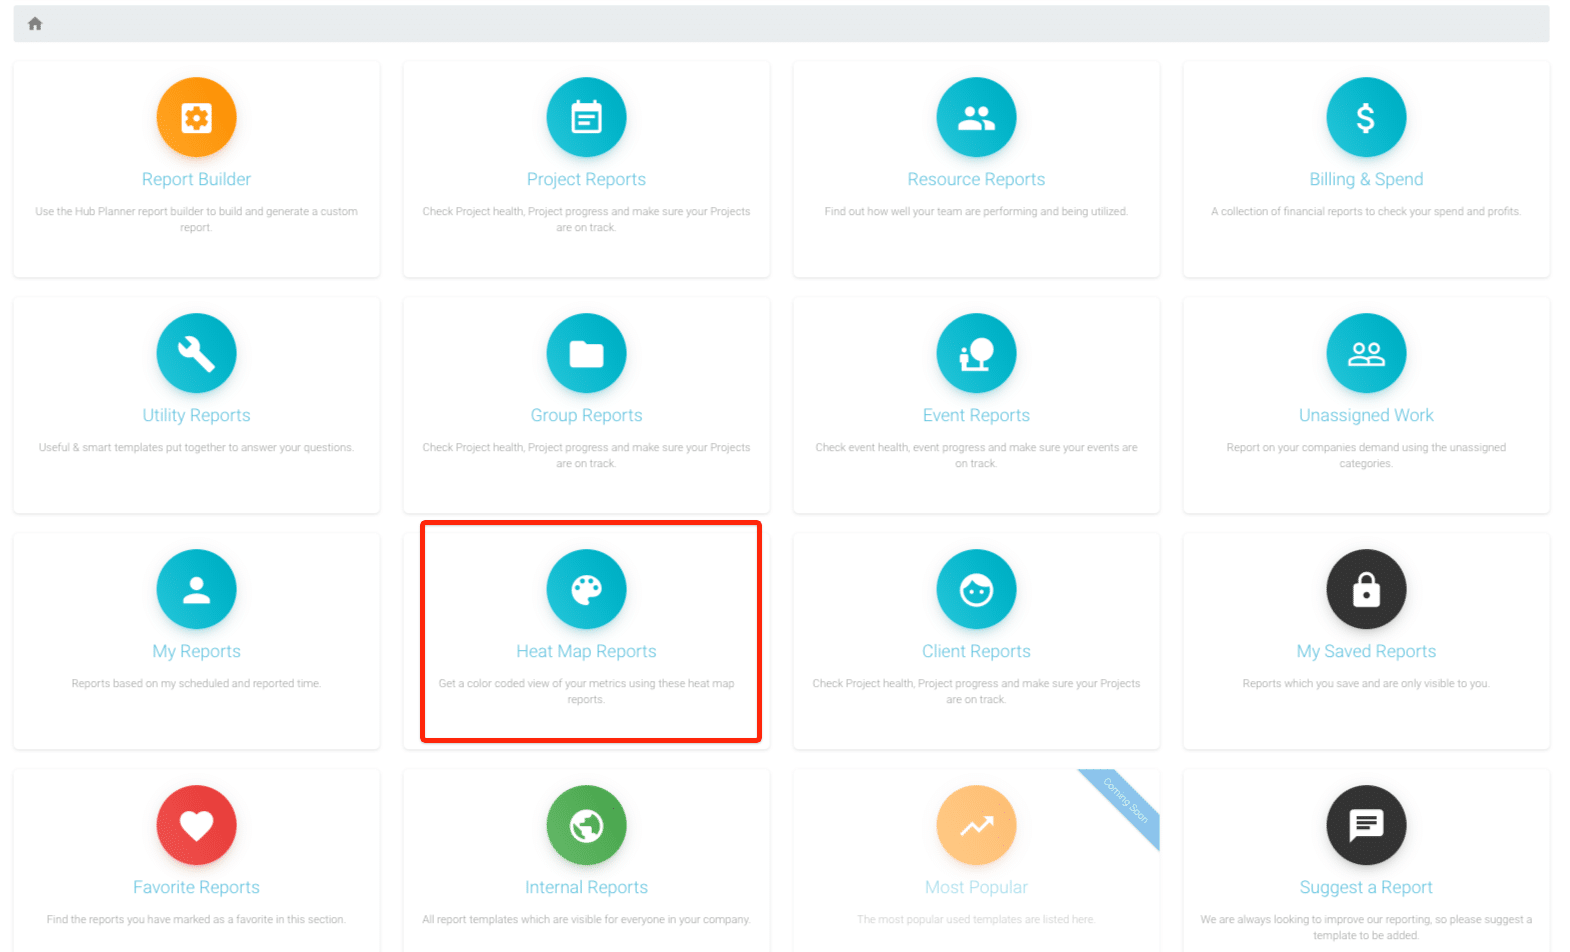
How do I access a Heat Map Reporting?
Within Hub Planner Reports, navigate to the Heat Maps Reports Folder located within the Reports Homepage. A number of templates appear brokedn down by category:
- Project
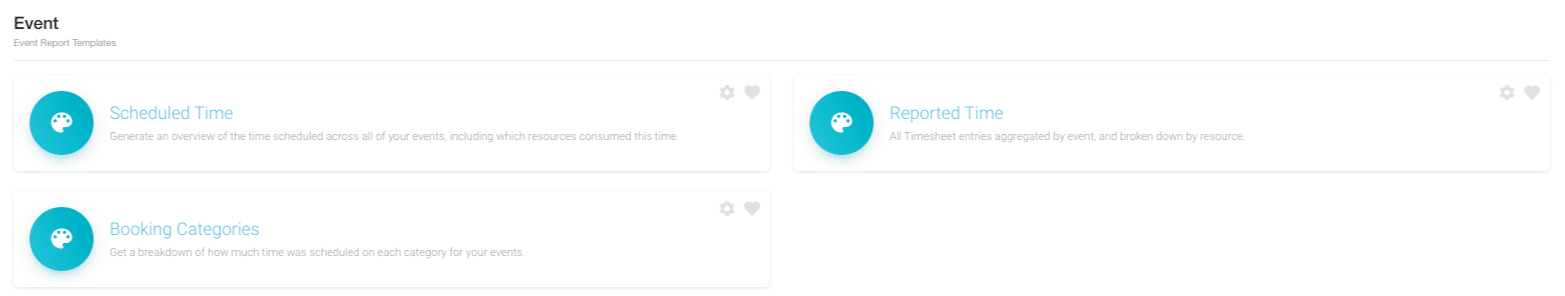
- Event
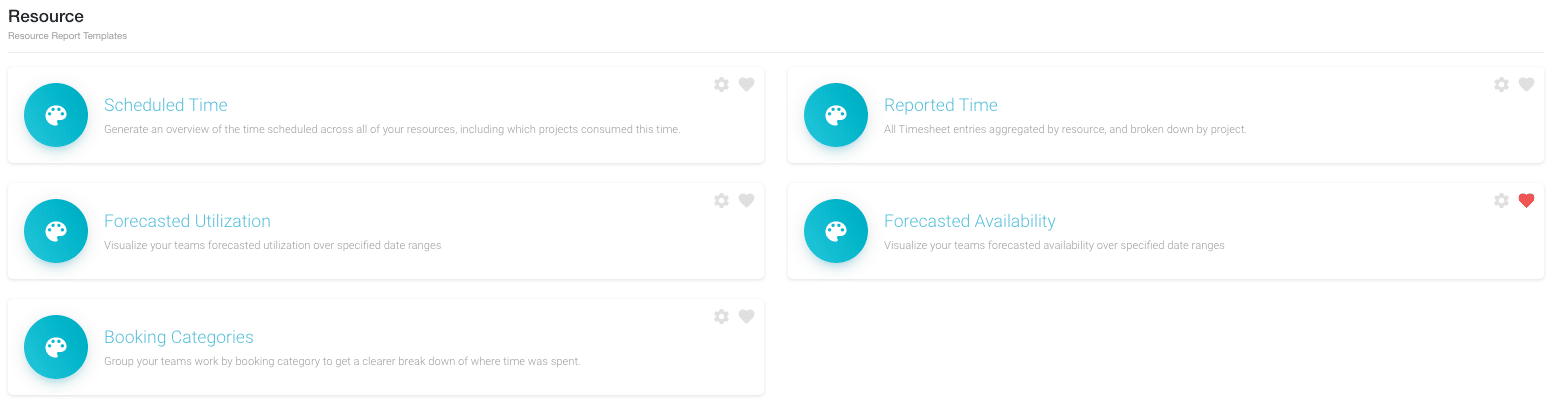
- Resource
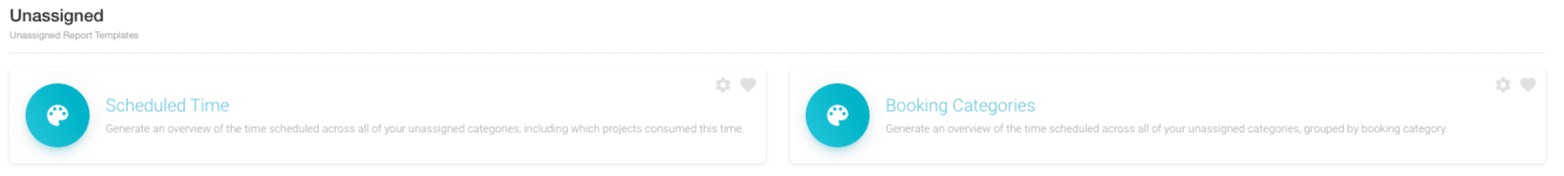
- Unassigned.
What templates are in the Heat Map Reporting Folder?
Project Reports

Event Reports
Resource Reports
Unassigned Work Reports
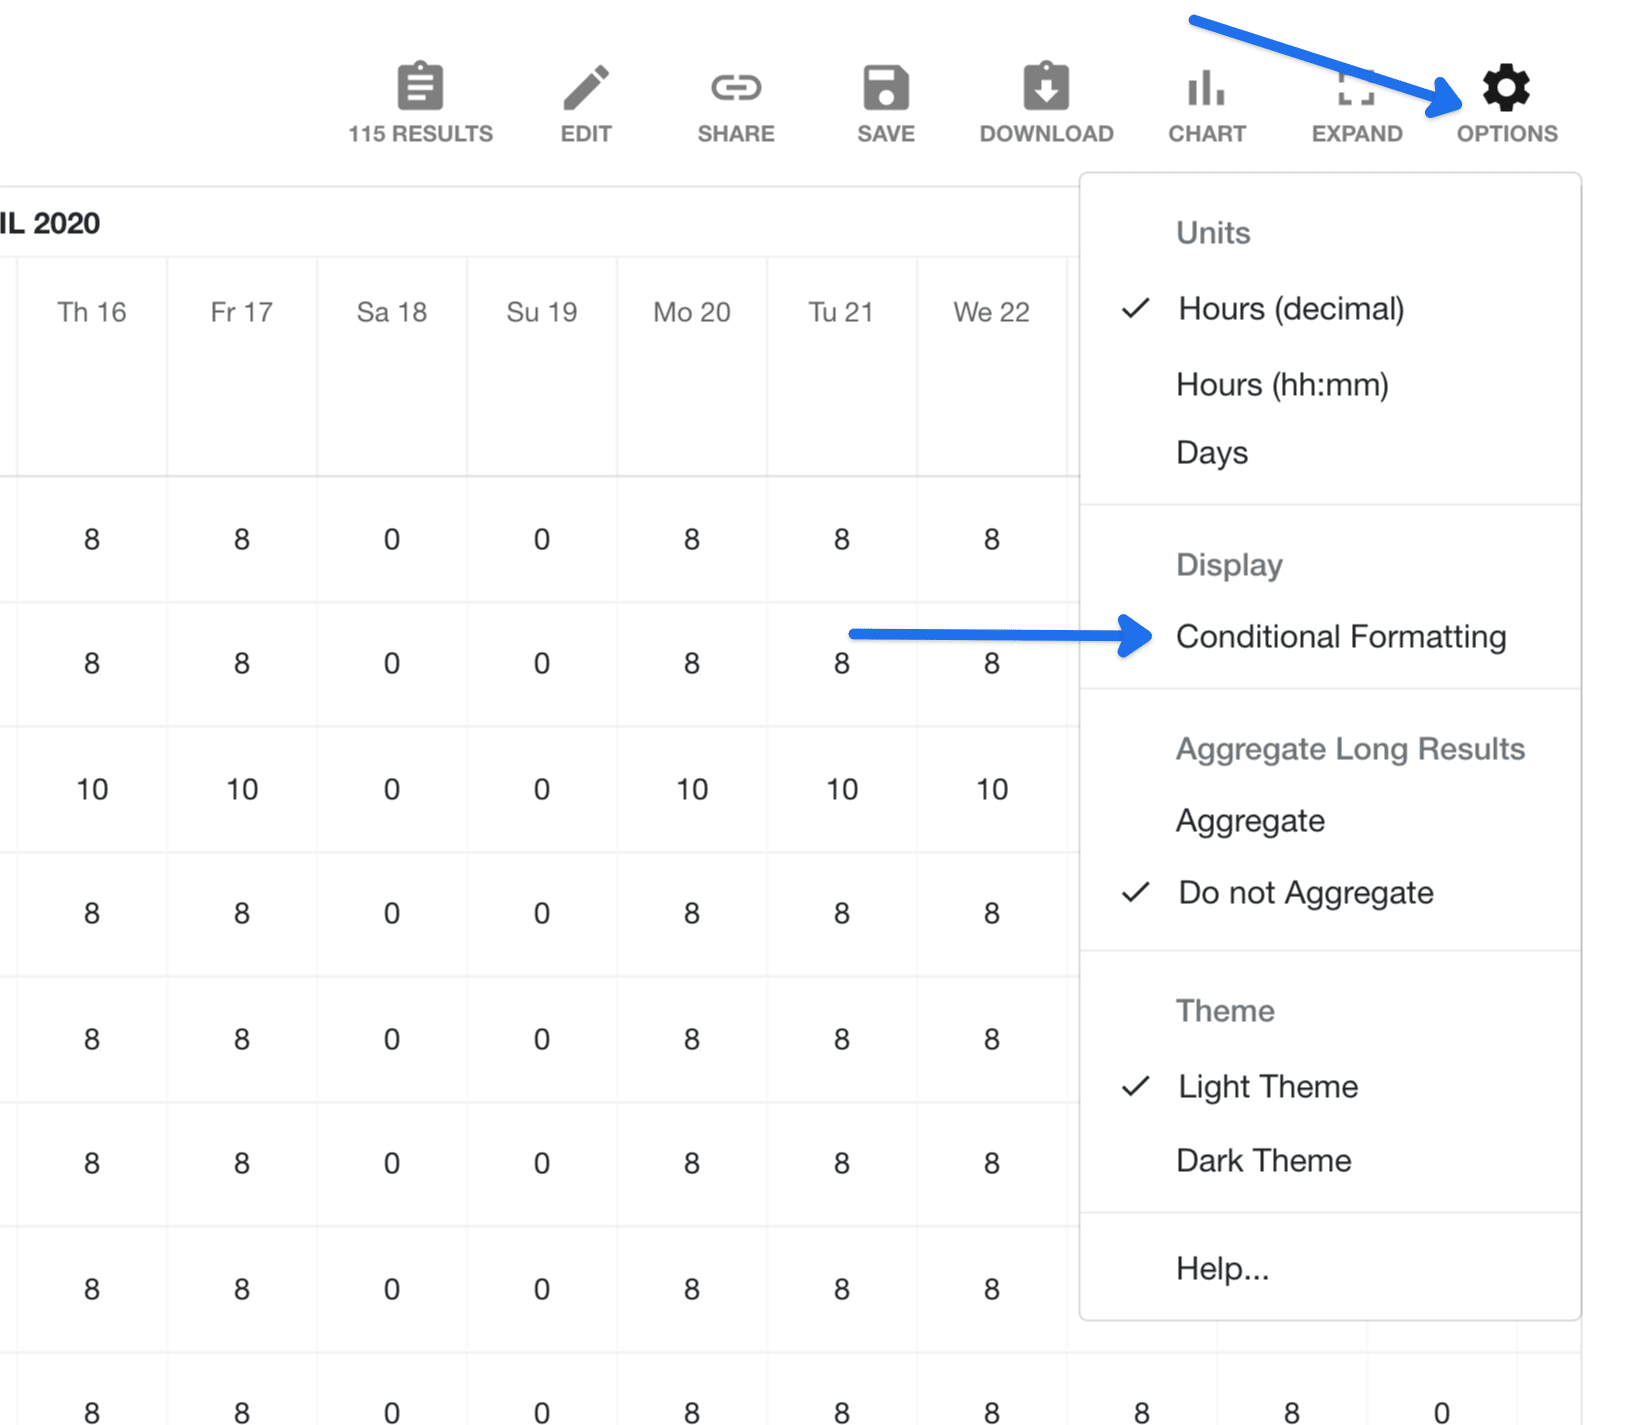
Can I format a Heat Map Reports?
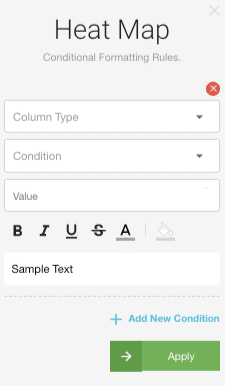
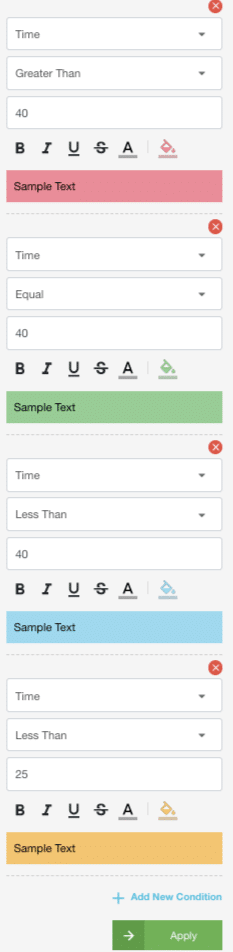
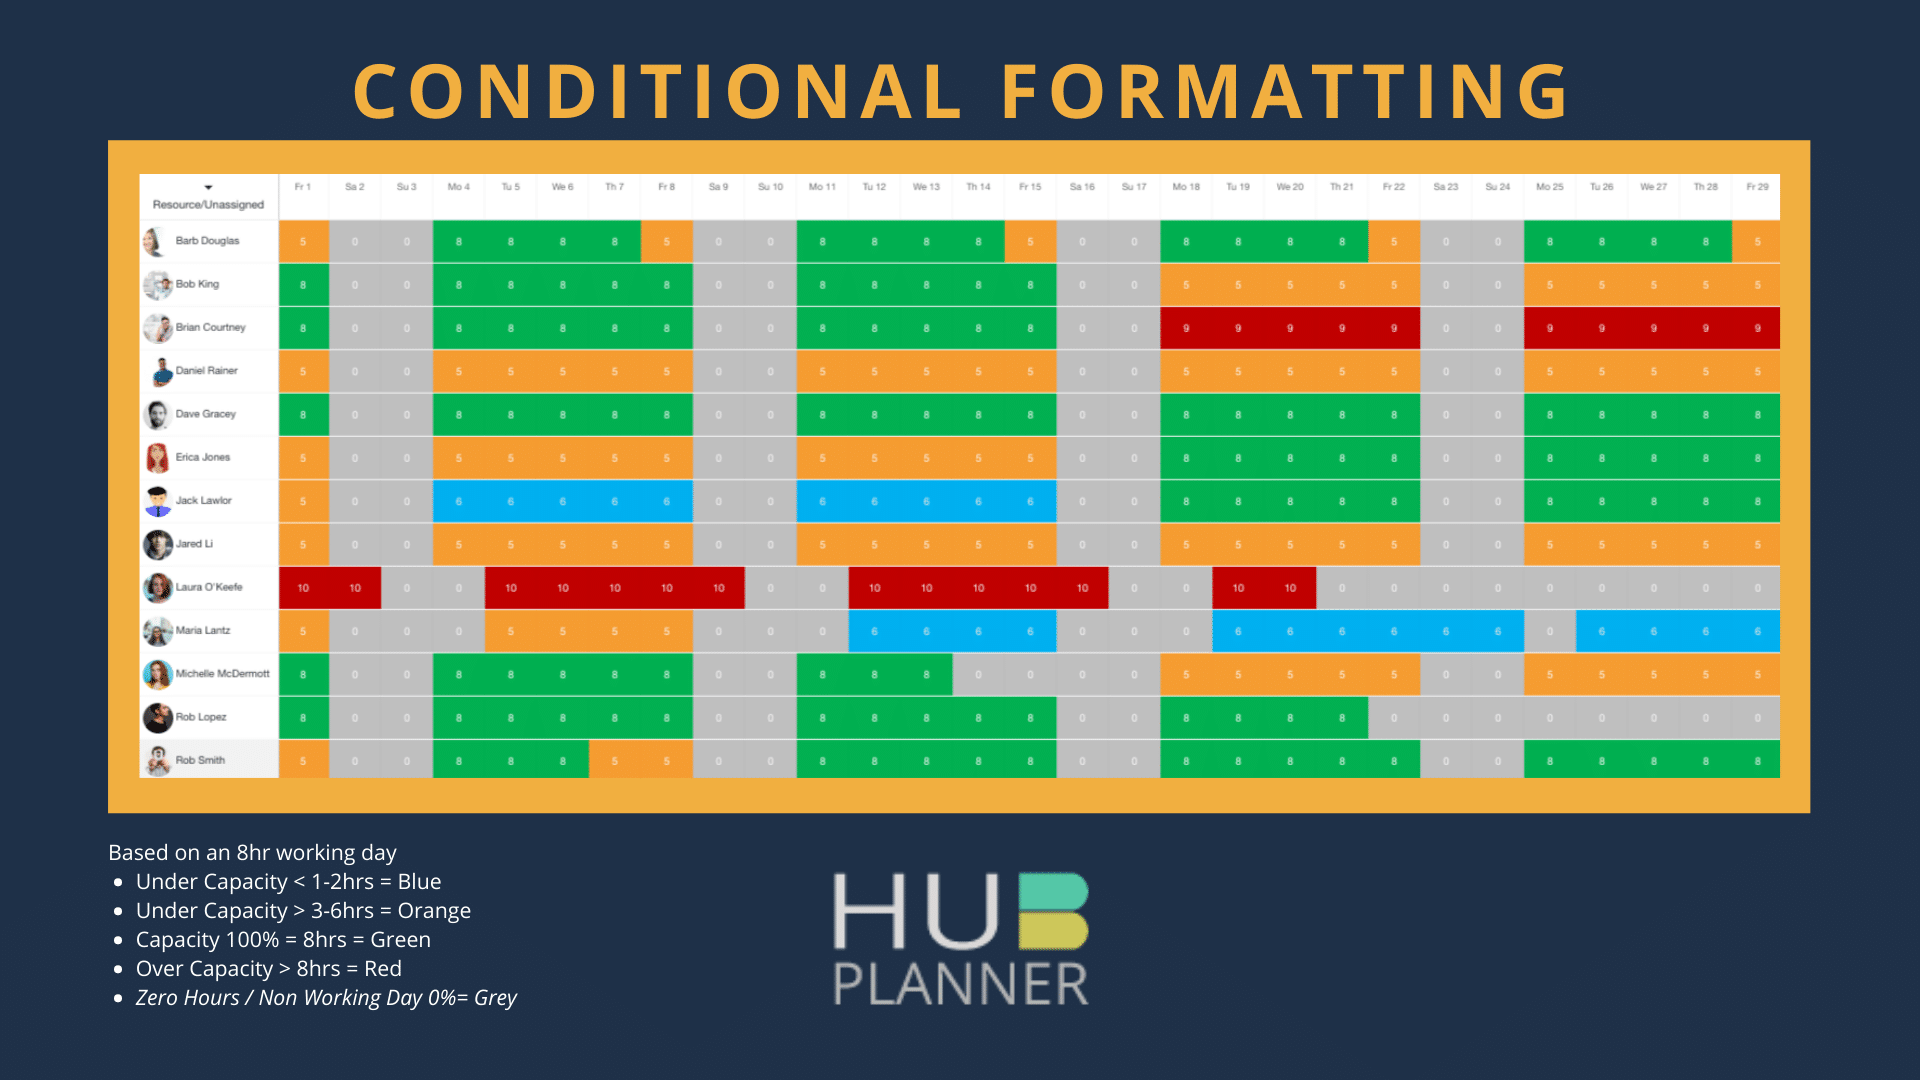
Yes! Use Conditional Formatting to highlight target data. There are a number of condition options to avail of together with a formatting toolbar to highlight or pin point data.
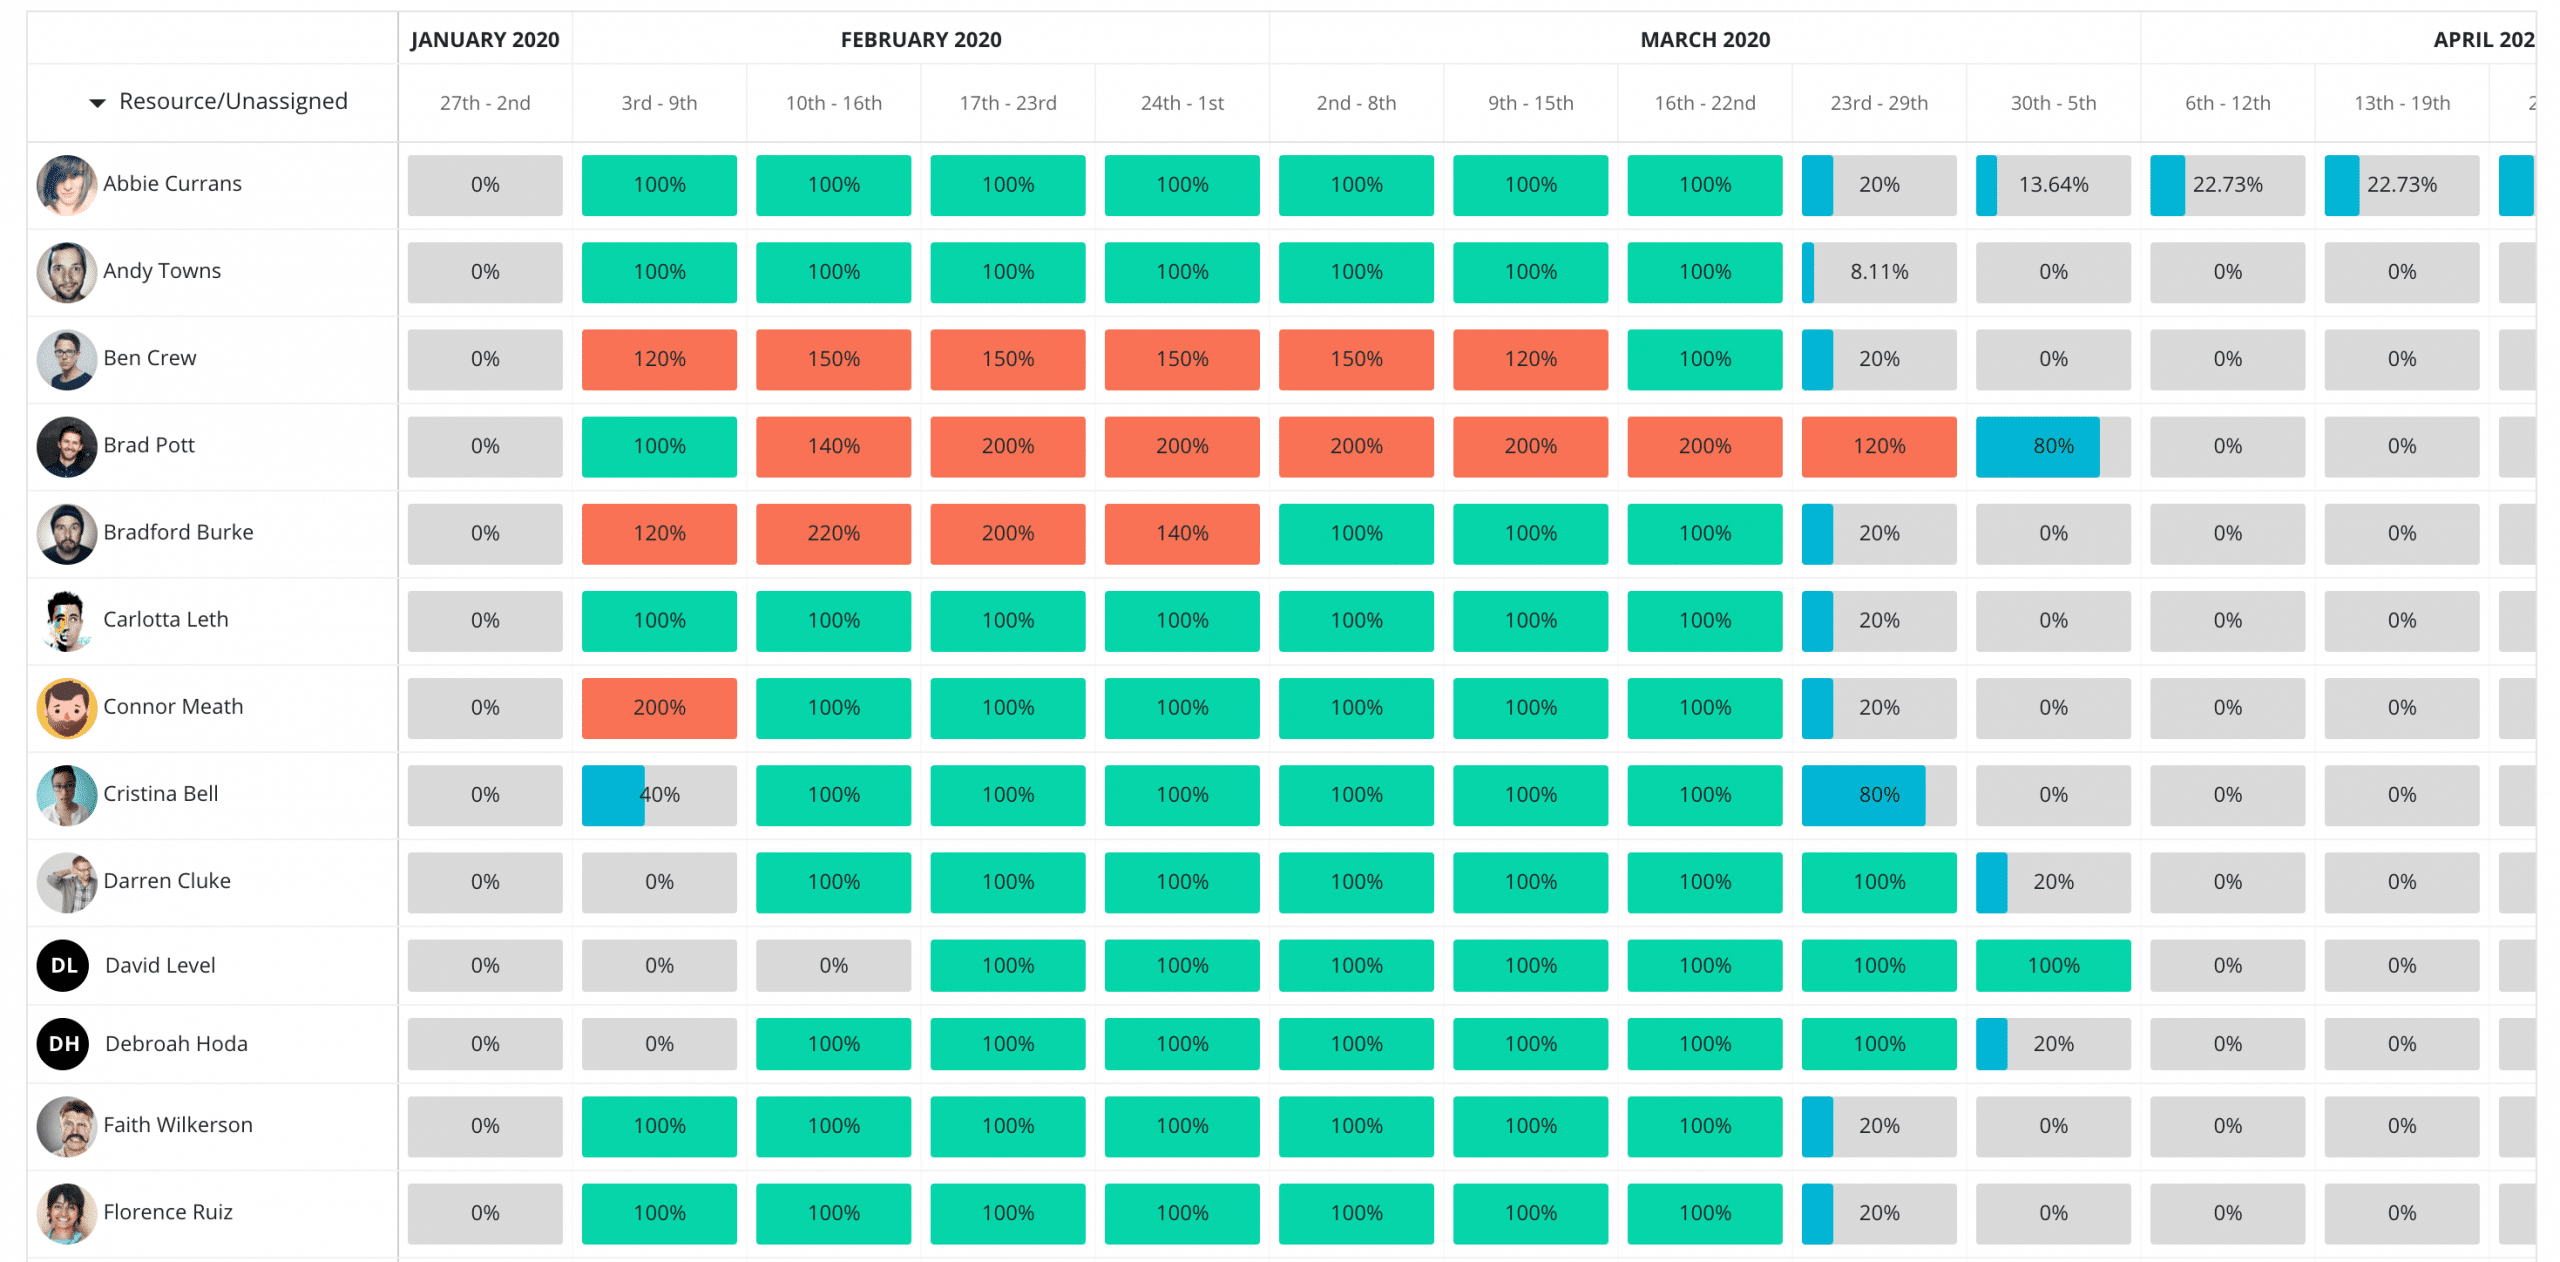
Example of Conditional Formatting of Resource Utilization
For further information on how to apply conditional formatting – go to: How to use Conditional Formatting in Resource Management or Work Smarter with Conditional Formatting
Can I change the Date frequency breakdown period?
Absolutely. Choose from Day, Week, Month or Year. To make this change:
- Report Toolbar
- Edit
- Columns
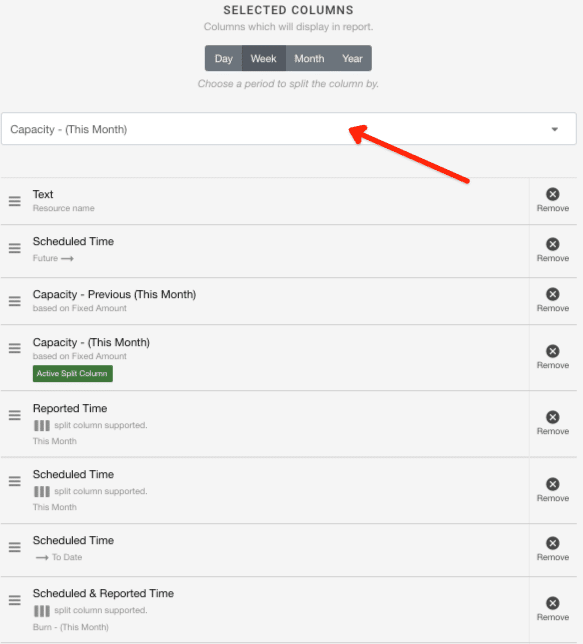
- Selected Columns – Choose your desired date frequency for your heat map report
- Update Report

How do I know which column the heat map report will split by?
The column will be identifiable by a green ‘Active Split Column’ within the Selected Columns panel.

Can I change the active column to create my heat map reporting from?
Yes. You can pick to choose which column you with to activate the heat map reporting from. There is a drop down on ‘Selected Columns’. Available columns to split will show here. Note not all columns are available to be split. You can identify the available columns to split by the left ‘Available Columns’. Note, the columns avaiable will be identiafiable by 3 vertical block lines.
Can I add any other columns to heat map reporting?
Yes.
- Report Toolbar
- Edit
- Columns
- Add the Available Columns to appear in Selected Columns
- Note that the green “Active Column Split” will highlight which data contains the Heat Maps breakdown.
- Opt to move the non active columns to the start or end of the report by clicking and dragging.
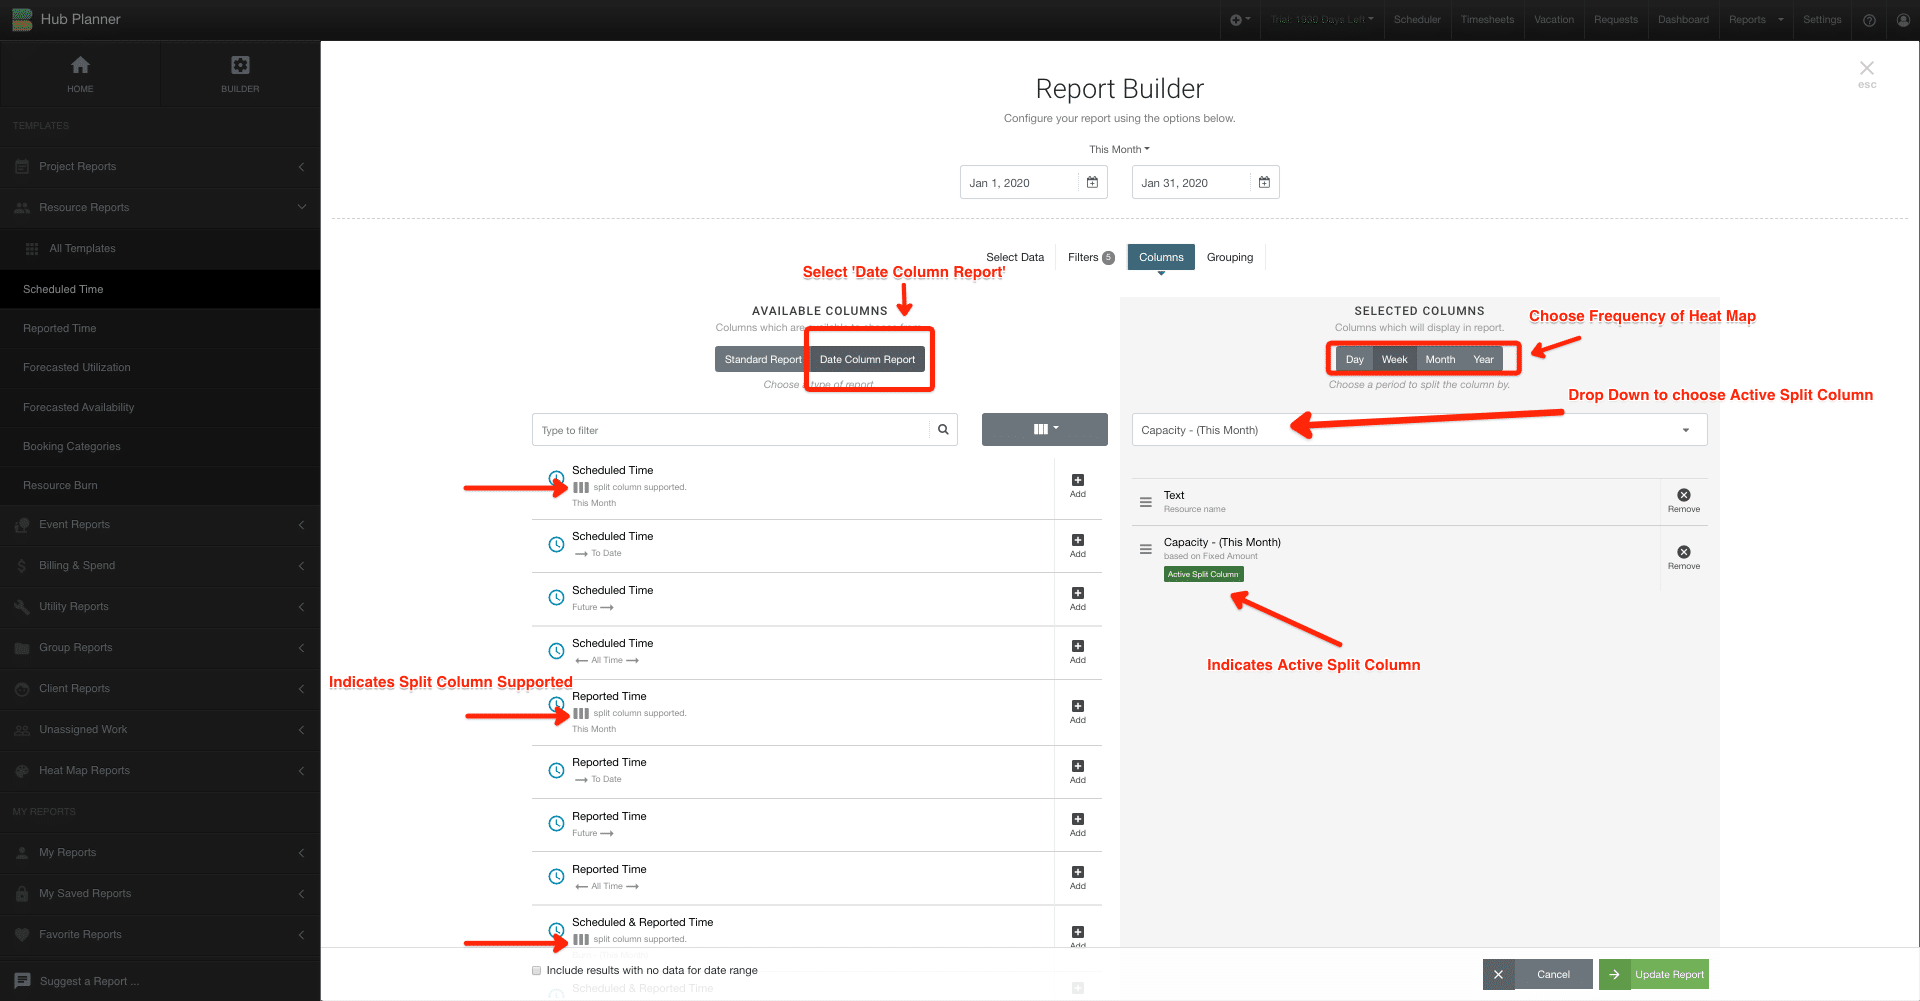
How to Create a Heat Map from the Report Builder?
- Report Builder
- Select Data – choose Project, Event, Resource, Unassigned
- Filters – choose Active or narrow down your search
- Columns
- Availbale Columns – click ‘Date Column Report’
- Select Available Columns
- Select Columns – pick frequency
- Choose the Active Column Split you wish to create a heat map from.
- Click Update Report
Use Conditional Formatting Rules for Capcity Planning and Project Forecasting
Toggling back and forth through your report dates will allow you to visualize your analytics. By using conditional formatting rules, you can clearly see any data you that requires focus and attention.
Going backward through reports, you might identify trends and learn from experiences on how resources where utilized. What worked well, what were the pitfalls? Going forward allows you to preempt scheduled resource hours. Are there resources overscheduled? Who is underutilized? Let’s be more proactive in our approach using the data from previous dates and forecasting trends for capacity planning and resource management.
Can I save this report?
Absolutely, you can choose to save this report either Internally or Privately. Should you choose to save the report internally. The report will be visible to those with access to the Internal Reports folder (your team). Be sure to title the conditional formatting report so that it is recognizable to your team.
To save the report privately, the report will save within the folder entitled ‘Saved Reports’. Again, ensure to entitle the report that you will recognize for future access.
To reenter into the report, simply select the saved report and the report will open as saved. Toggle through the dates accordingly to update results.


Can I alter the dates?
Yes, either toggle left and right. Alternatively, you can opt to choose pre-selected or customized dates from the date pricker.

Further Reading
- Reports Feature Page
- Reports Press Release Blog Post
- Navigating Around Reports