Conditional Formatting Rules Example
Conditional Formatting Rules are a way to segregate or highlight data from a report you have produced. For example. Highlight any resources who are overscheduled and view in a daily breakdown. The great aspect of Conditional Formatting in Hub Planner is that you can apply multiple conditional formatting rules. Using the example above, you might create multiple rules to show the capacity or utilization hours of resources in a daily breakdown. So, I might create the following rules and formatting colors:
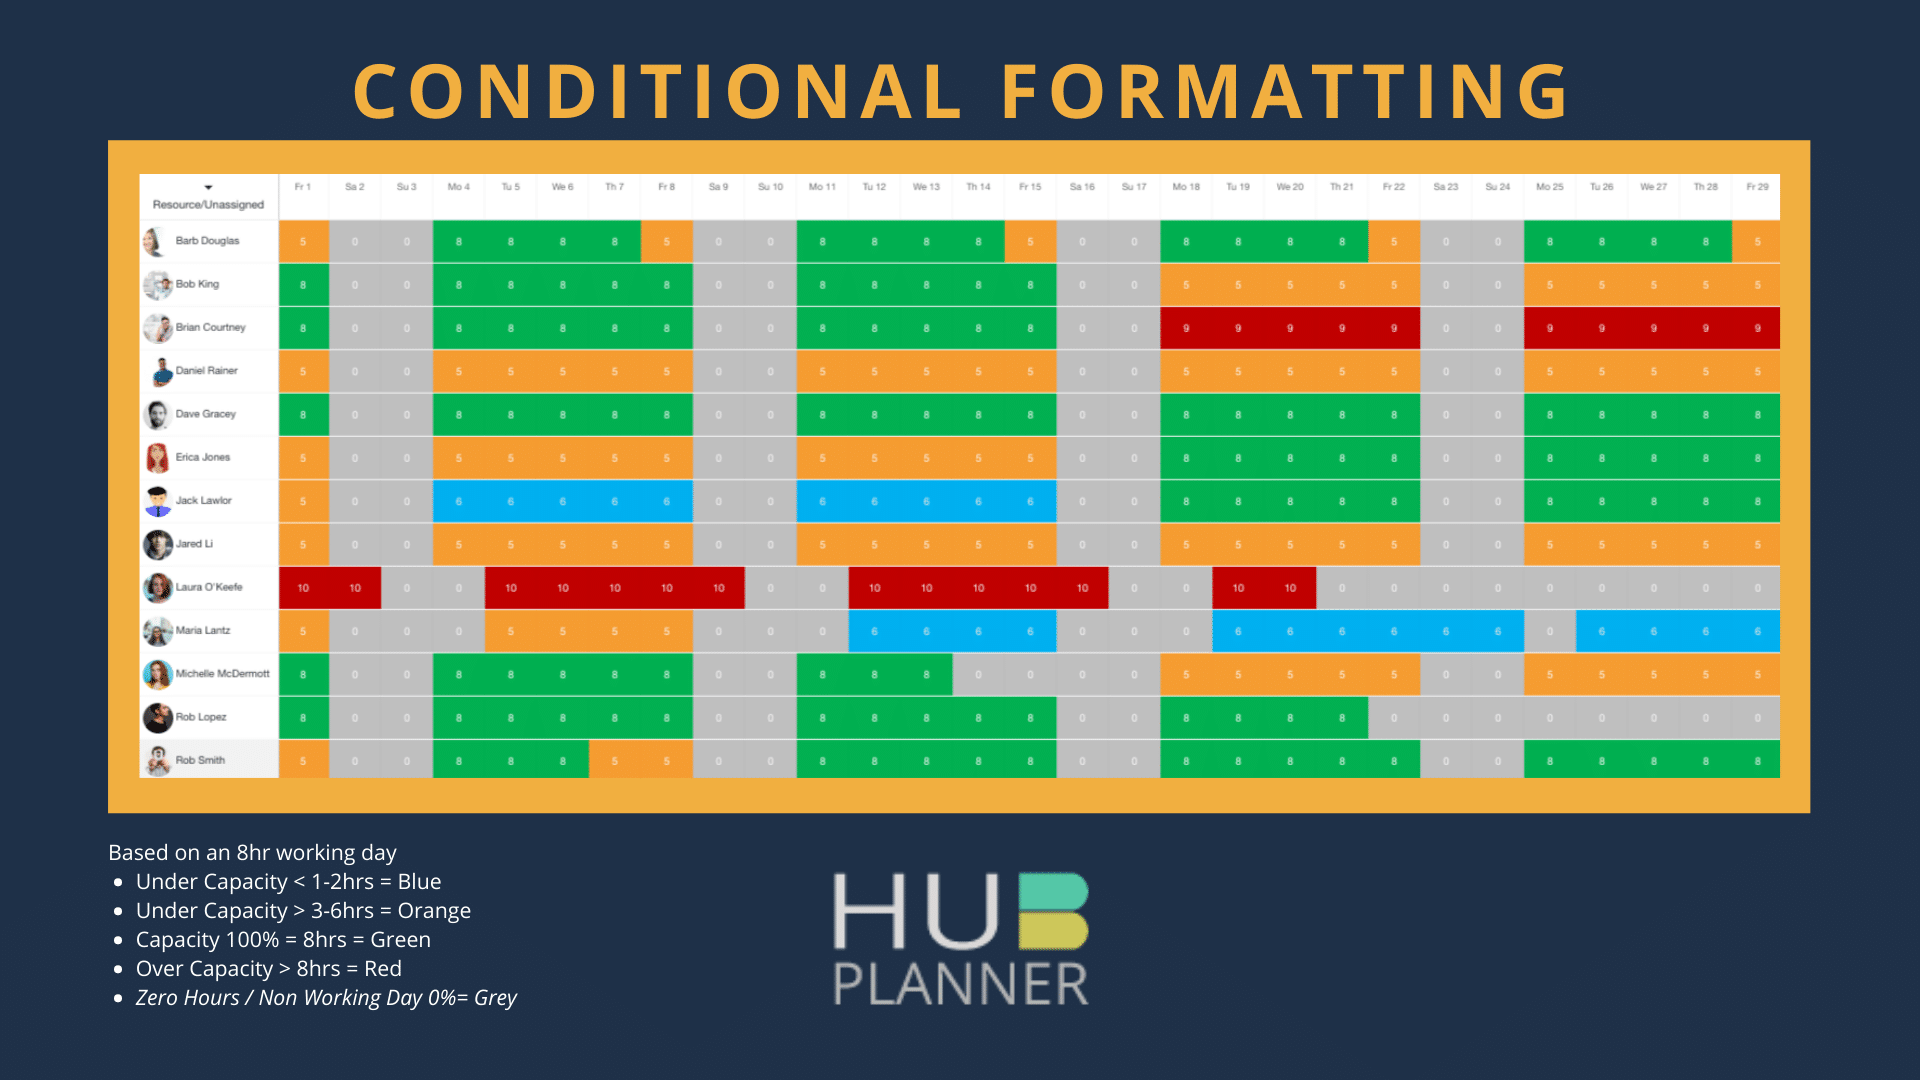
Example of applying conditional formatting rules to highlight resource capacity based on an 8hr day. This will flag any resources overbooked or indeed underbooked.
Apply conditional formatting rules as follows:
Any resource under capacity by 1 or 2 hours (<8), change the color of their hours to ‘blue’.
Resources under capacity by 3 – 6 hours (</=6), change the color to ‘orange’.
Resources at 100% utilization of 8hrs (=8), change the color of their hours to ‘green’.
Any resources over capacity greater than 8hrs (>8), changes to the color ‘red’.
Any time at zero or non working day (=0), change to the color grey.
Why apply Conditional Formatting Rules in Resource Management?
Conditional Formatting Rules allow you to flag, highlight, or emphasize data. Hub Planner Reports produces real-time live analytics which is so important in Resource Management. What conditional formatting rules allow you to do is bypass a lengthy process of analyzing the data. In turn, you react quicker to forecasting resource planning requirements based on highlighted results.
Focus on the important aspects that allows you to plan and forecast capacity planning, resource utilization and project budgets more efficiently.
Where can I find Conditional Formatting Rules
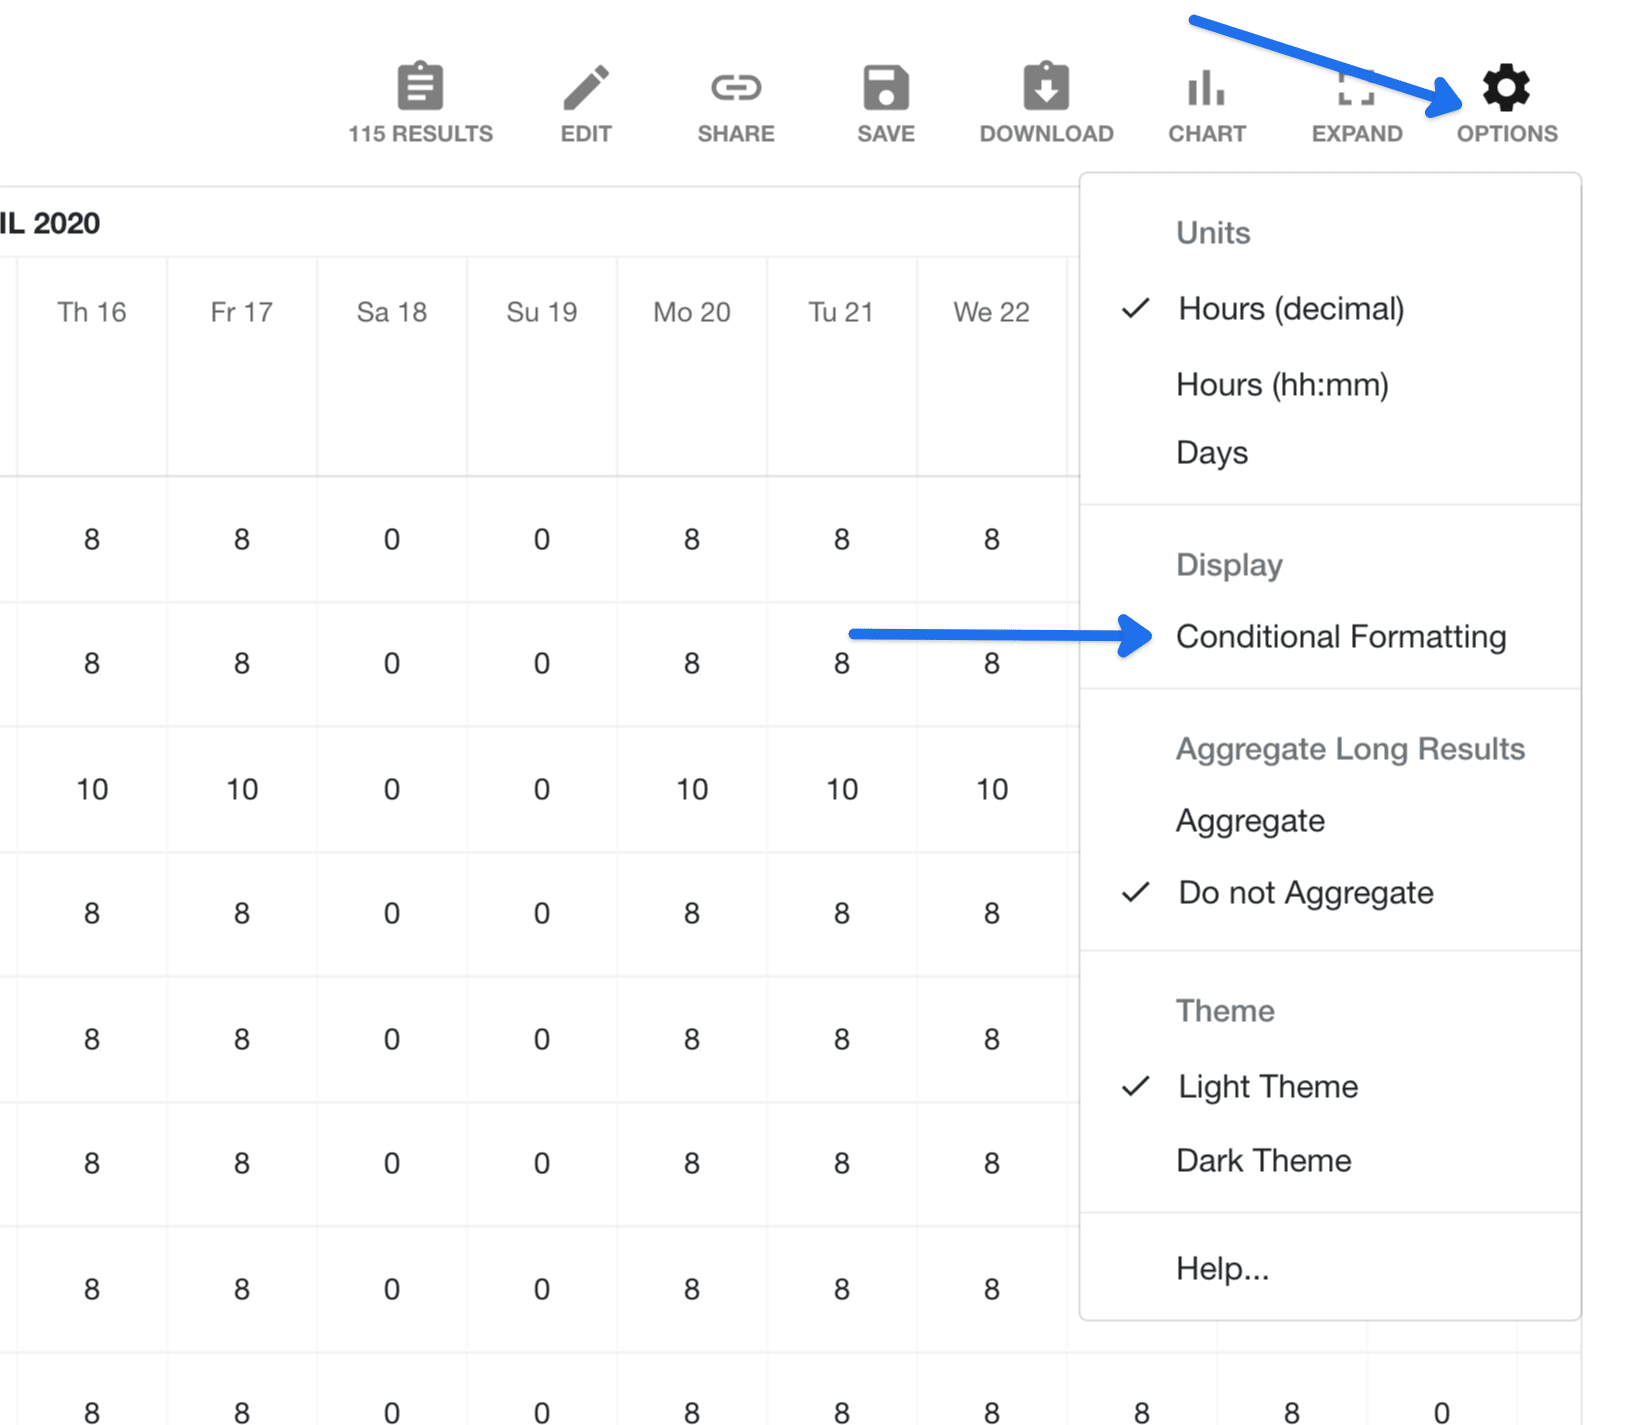
You need to be within one of the report templates to have access to Conditional Formatting options. The Report Toolbar is located at the top right hand side of the report you have produced. From the Report Toolbar, click Options followed by Conditional Formatting. A pop-up appears to the right hand side of the page. Here is where you can apply Conditional Formatting Rules.
How to Apply Conditional Formatting Rules
 To apply a Conditional Formatting Rule, you need to select from the following condition options:
- Column Type
- Condition
- Value
Once you have selected the conditions, you now can select the formatting options of how the report is highlighted.
- Bold
- Italics
- Underlined
- Strikethrough
- Font Color
- Cell Background Color
A sample of how the Conditional Formatting Rule will be highlighted is shown in the sample box.
Structural Logic Format
Set one or multiple real time conditional formatting rules for your report.
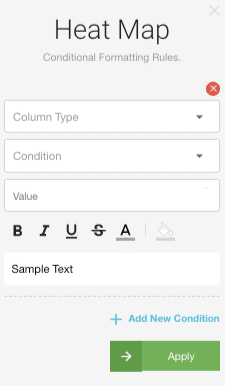
From the resource and project reporting toolbar, click ‘Format’. A pop up to apply Heat Map Conditional Formatting rules will open. There are just a few short steps to create each condition to format your report.

Column Type
Choose the column from the drop down list you wish to format. Depending on the report type will determine the conditional formatting you can apply to a column. Options include:
- Time
- Spend
- Percentage
- Text
Conditions
There are 6 Time, Spend and Percentage conditions you can apply to format your report:
- Equal
- Greater Than
- Greater Than or Equal
- Less Than
- Less Than or Equal
- Not Equal
There are 5 Text conditions you can apply to format your report:
- Starts With
- Ends With
- Contains
- Equal
- Not Equal
Value
Enter text or toggle a value figure to determine results.
Formatting Toolbar
The next line allows you to select and choose what way you wish results to be displayed. Options include:
 Bold
Bold- Italics
- Underline
- Strikethrough
- Text Font Color
- Background Color
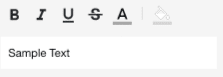
A snapshot of how the results will be displayed is show in the next field.
You can add more than one conditional format to your report. Simply select + Add New Condition to apply the next formatting condition. Now, repeat the above steps. To delete a conditional format, simply X the required.
Lastly, click Apply for results to adjust and activate.
What will it look like?
Your report will look something like the below. Depending on what style of report you apply conditional formatting rules to. Below is a Heat Map style Resource Report. The below report provides me with a breakdown of resource hours scheduled each day for the month. Now I can see where I need to perhaps adjust my resource planning in order to ensure maximum utilization.
Toggle along the dates backwards and forwards to see any past data you can learn from. By going forwrds along the project pipeline can you preempt some trends for example. Now you can cleary avoid any resource over scheduling in advance with the conditional formatting rules applied.
Use Conditional Formatting Rules for Capcity Planning and Project Forecasting
Toggling back and forth through your report dates will allow you to visualize your analytics. By using conditional formatting rules, you can clearly see any data you that requires focus and attention.
Going backward through reports, you might identify trends and learn from experiences on how resources where utilized. What worked well, what were the pitfalls? Going forward allows you to preempt scheduled resource hours. Are there resources overscheduled? Who is underutilized? Let’s be more proactive in our approach using the data from previous dates and forecasting trends for capacity planning and resource management.
Can I save this report?
Absolutely, you can choose to save this report either Internally or Privately. Should you choose to save the report internally. The report will be visible to those with access to the Internal Reports folder (your team). Be sure to title the conditional formatting report so that it is recognizable to your team.
To save the report privately, the report will save within the folder entitled ‘Saved Reports’. Again, ensure to entitle the report that you will recognize for future access.
To reenter into the report, simply select the saved report and the report will open as saved. Toggle through the dates accordingly to update results.


Can I alter the dates?
Yes, either toggle left and right. Alternatively, you can opt to choose pre-selected or customized dates from the date pricker.

Further Reading
- Reports Feature Page
- Reports Press Release Blog Post
- Navigating Around Reports