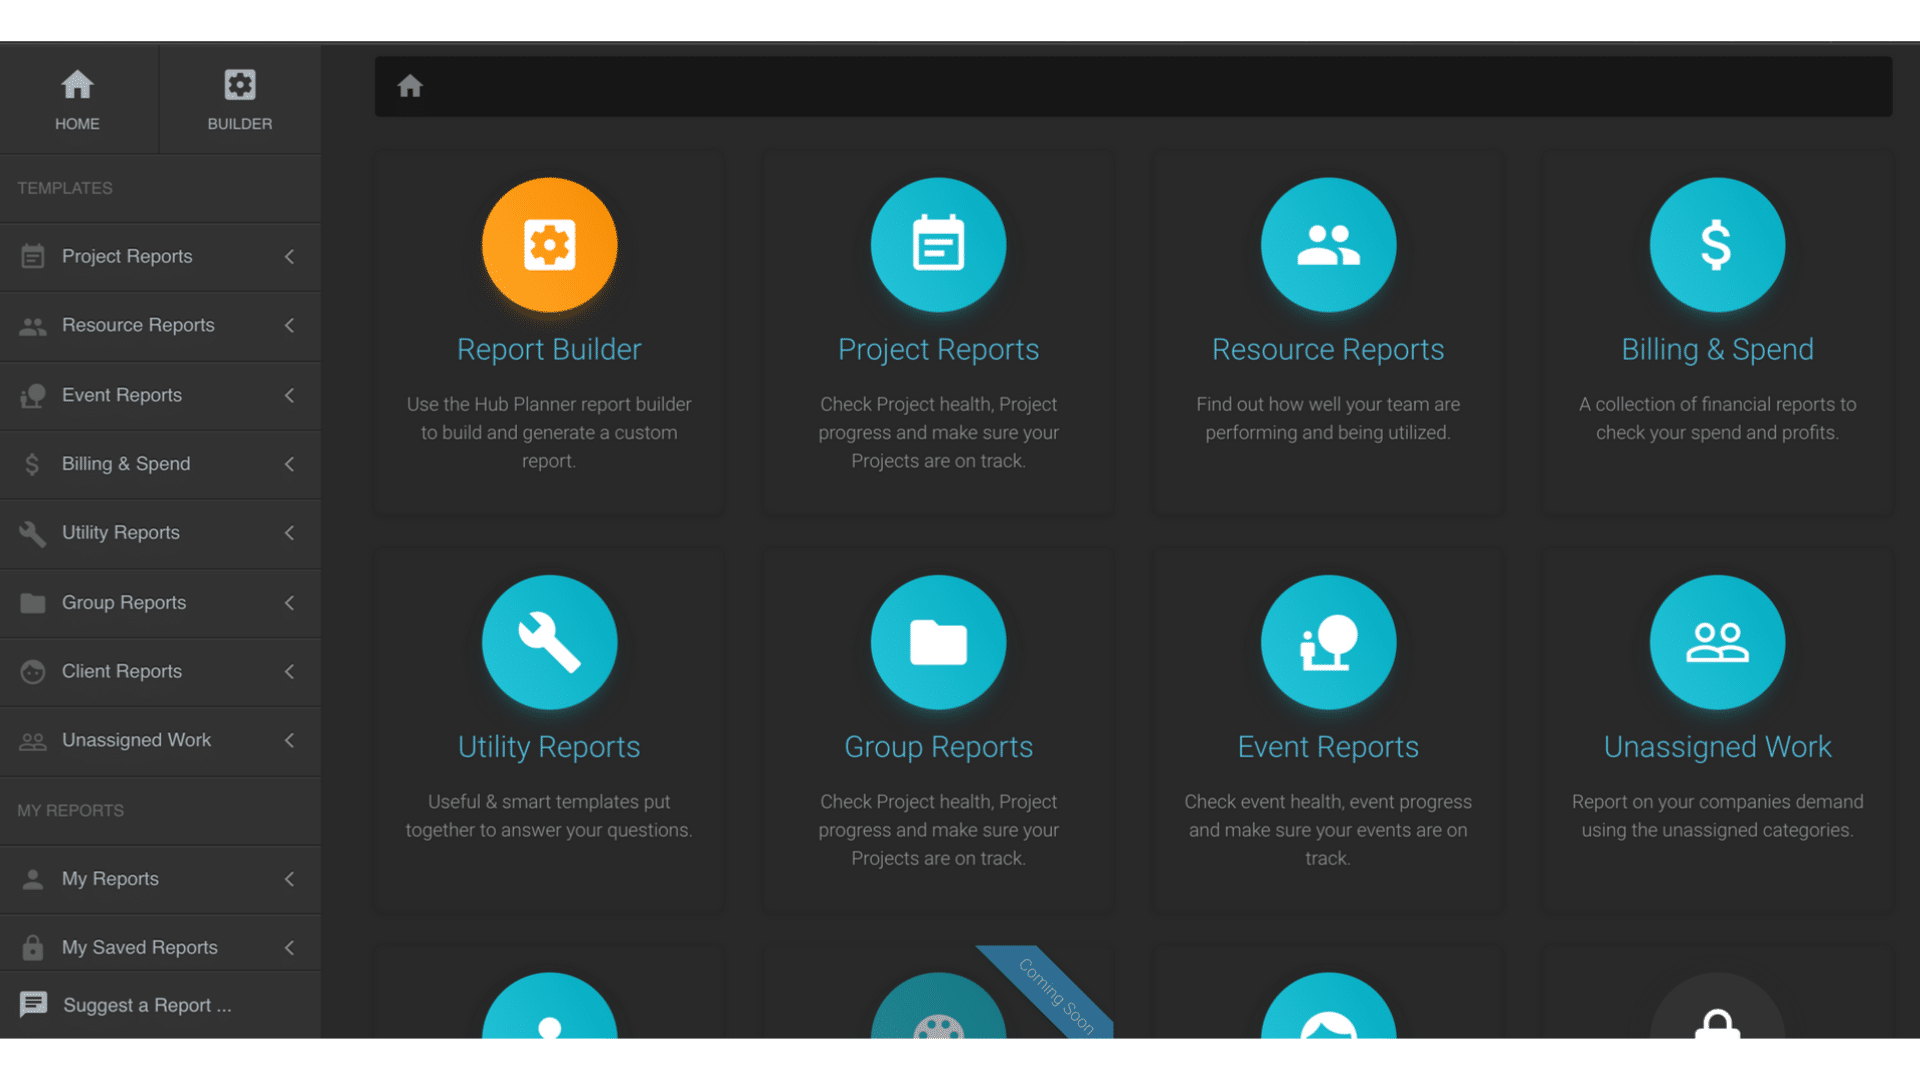
What is the Report Toolbar?
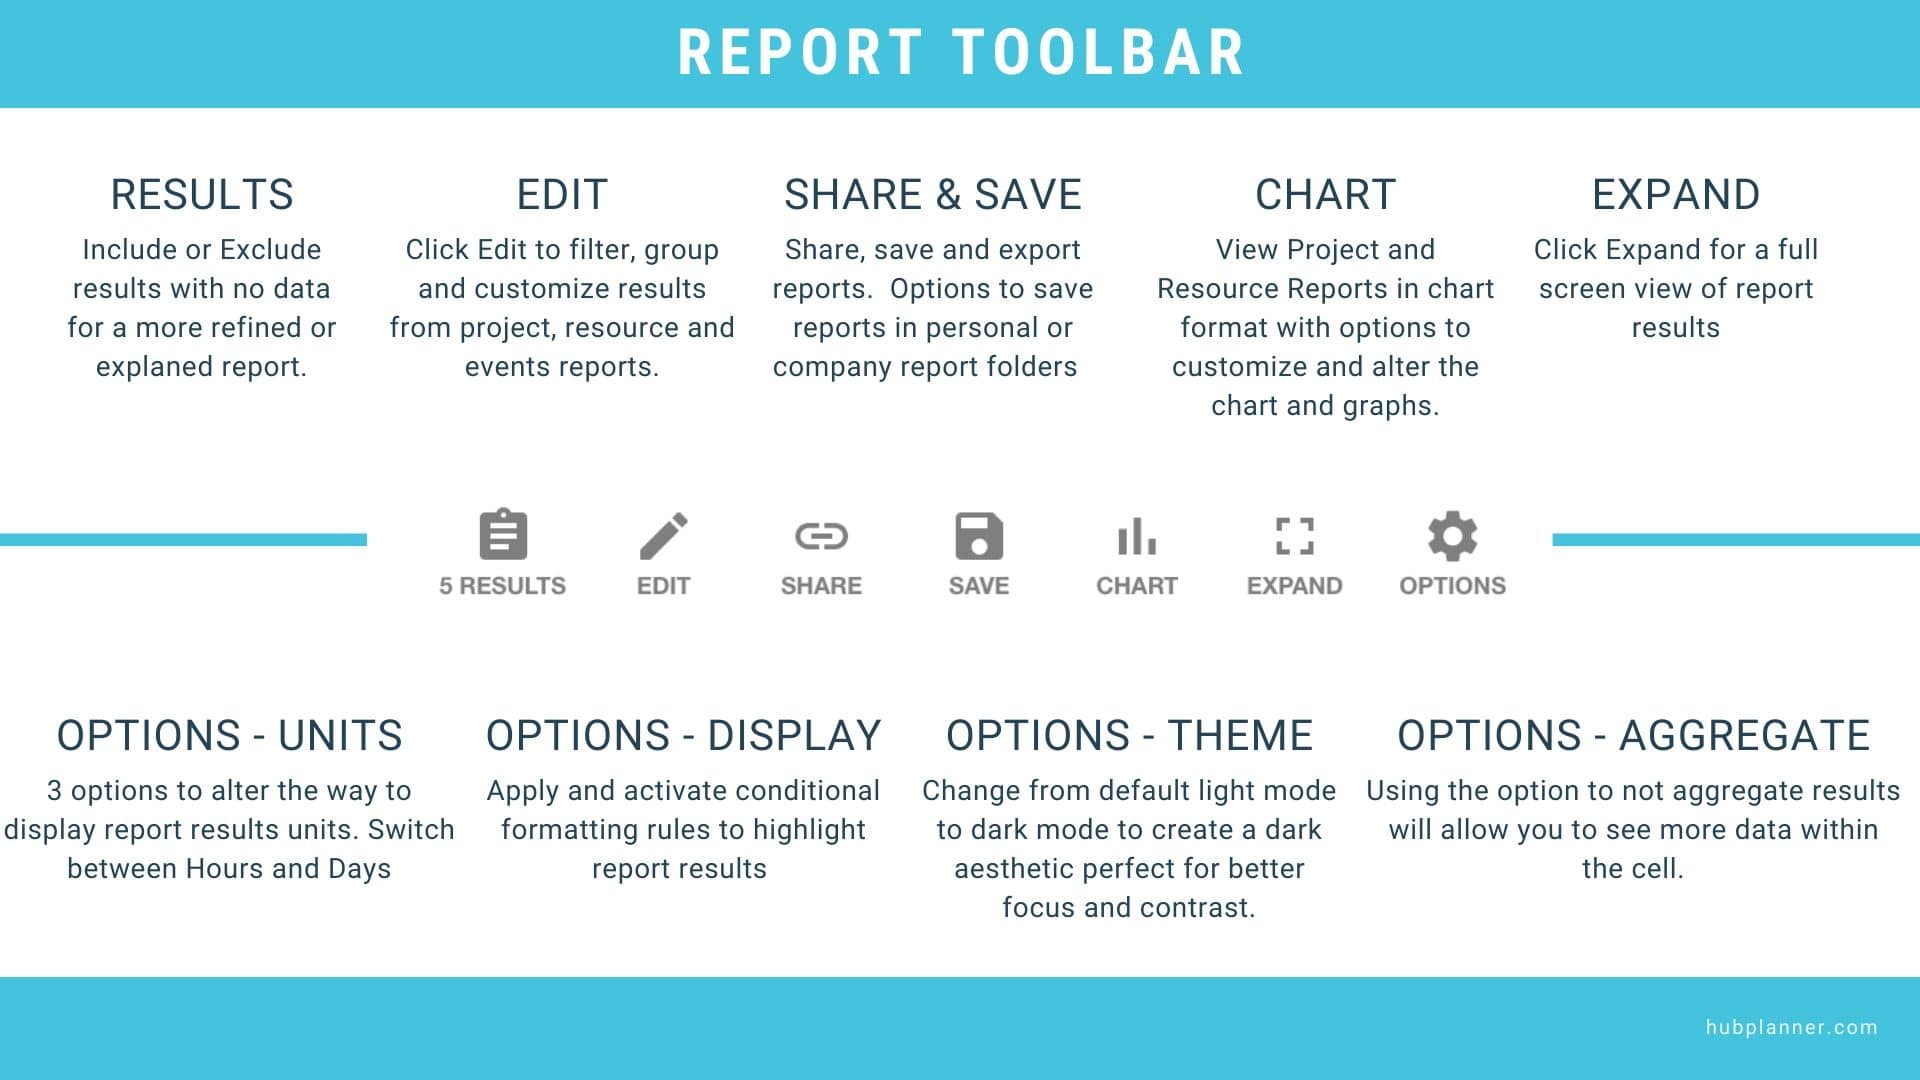
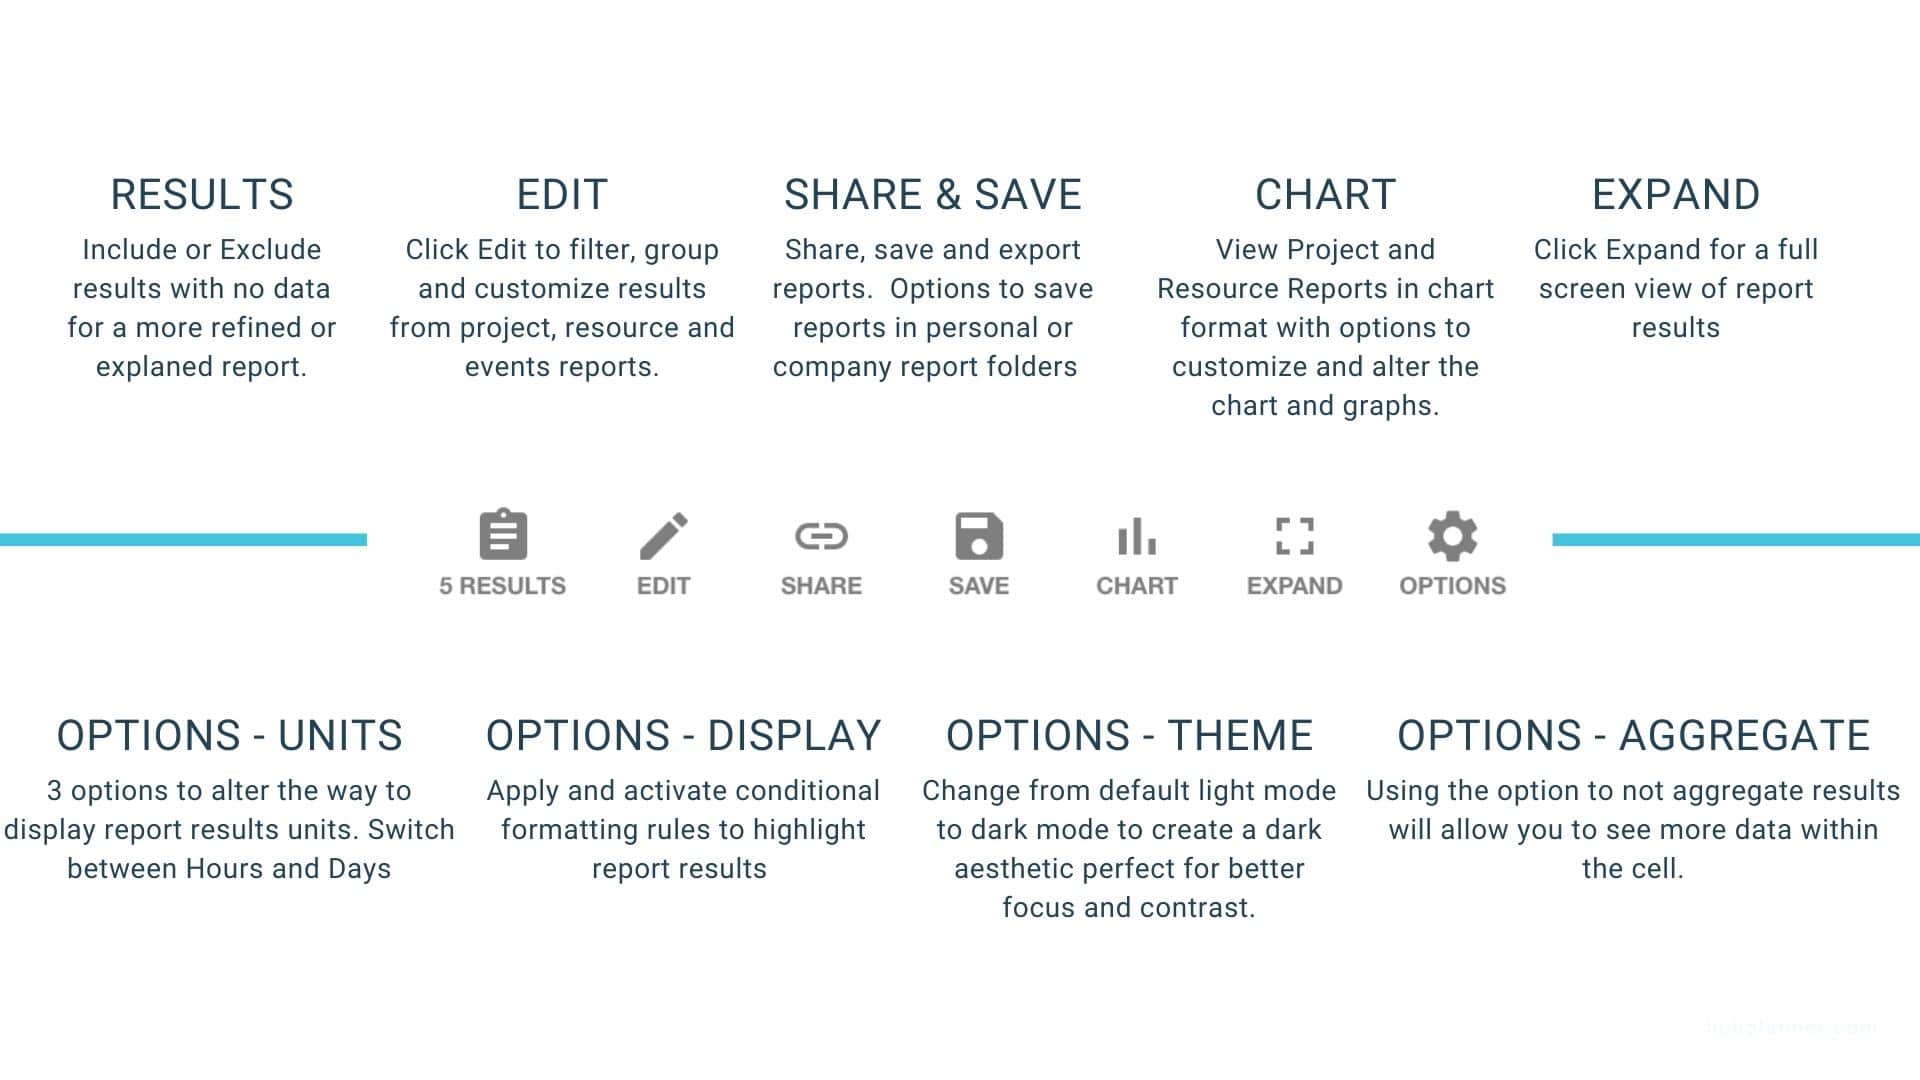
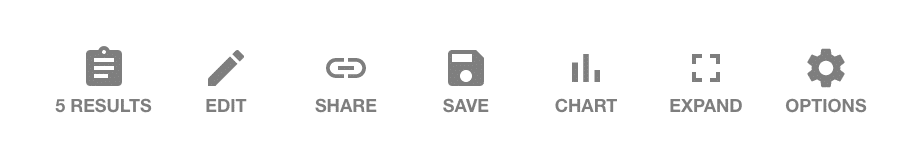
The report toolbar is number of icons that allow you to make changes to the way the reports are displayed, filtered and shared. Let’s take you through them.
Report Toolbar Grouping Buttons
The Report Toolbar also has pre defined grouping buttons to the left of the interface.

The Report Toolbar Grouping Buttons allow you to switch between Projects/Events, Resources/Unassigned, Booking Categories and frequency of days. We will discuss the Report Toolbar Grouping in further details below.
Total Results
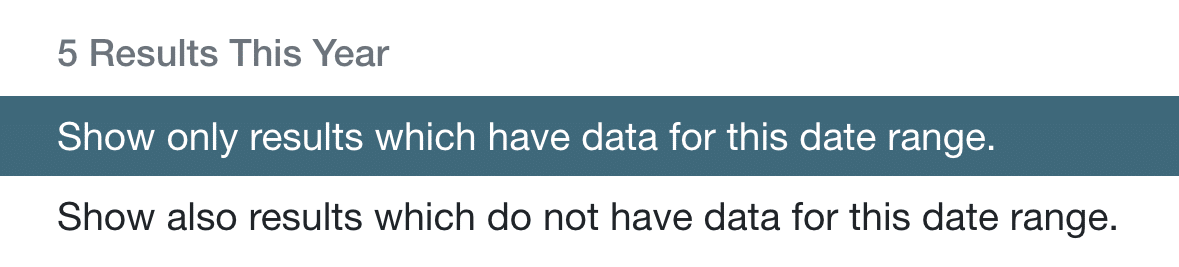
Once a report has been generated, users have sight of ‘total results’ returned. Note, there are two options to utilize within this tool.
- Show only results that have data for this date range
- Show also results which do not have data for this date range. Include no data within results of this date range
For example, Scheduled Spend. From 10 projects, Resource is scheduled to 5 within this month. They are also scheduled on 2 other projects last month. By selecting the first option, the 5 projects with scheduled time against them will return data. Should the second option be selected, all 7 projects will return the data.
You can also access these options within the report builder. Or by selecting the filters and data options within the report toolbar.
How to filter reports?
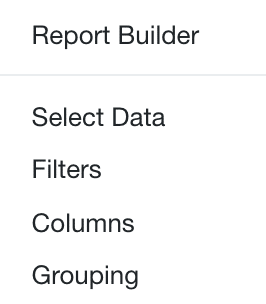
You can alter the filters of the templates by clicking on the settings cog beside each report name in the sidebar. You can also access from the Report Toolbar by clicking EDIT followed by one of the drop down options. Either Select Data, Filters, Columns or Grouping. Alternatively, click the Report Builder icon in the Reports Home page.
What are the filter options?
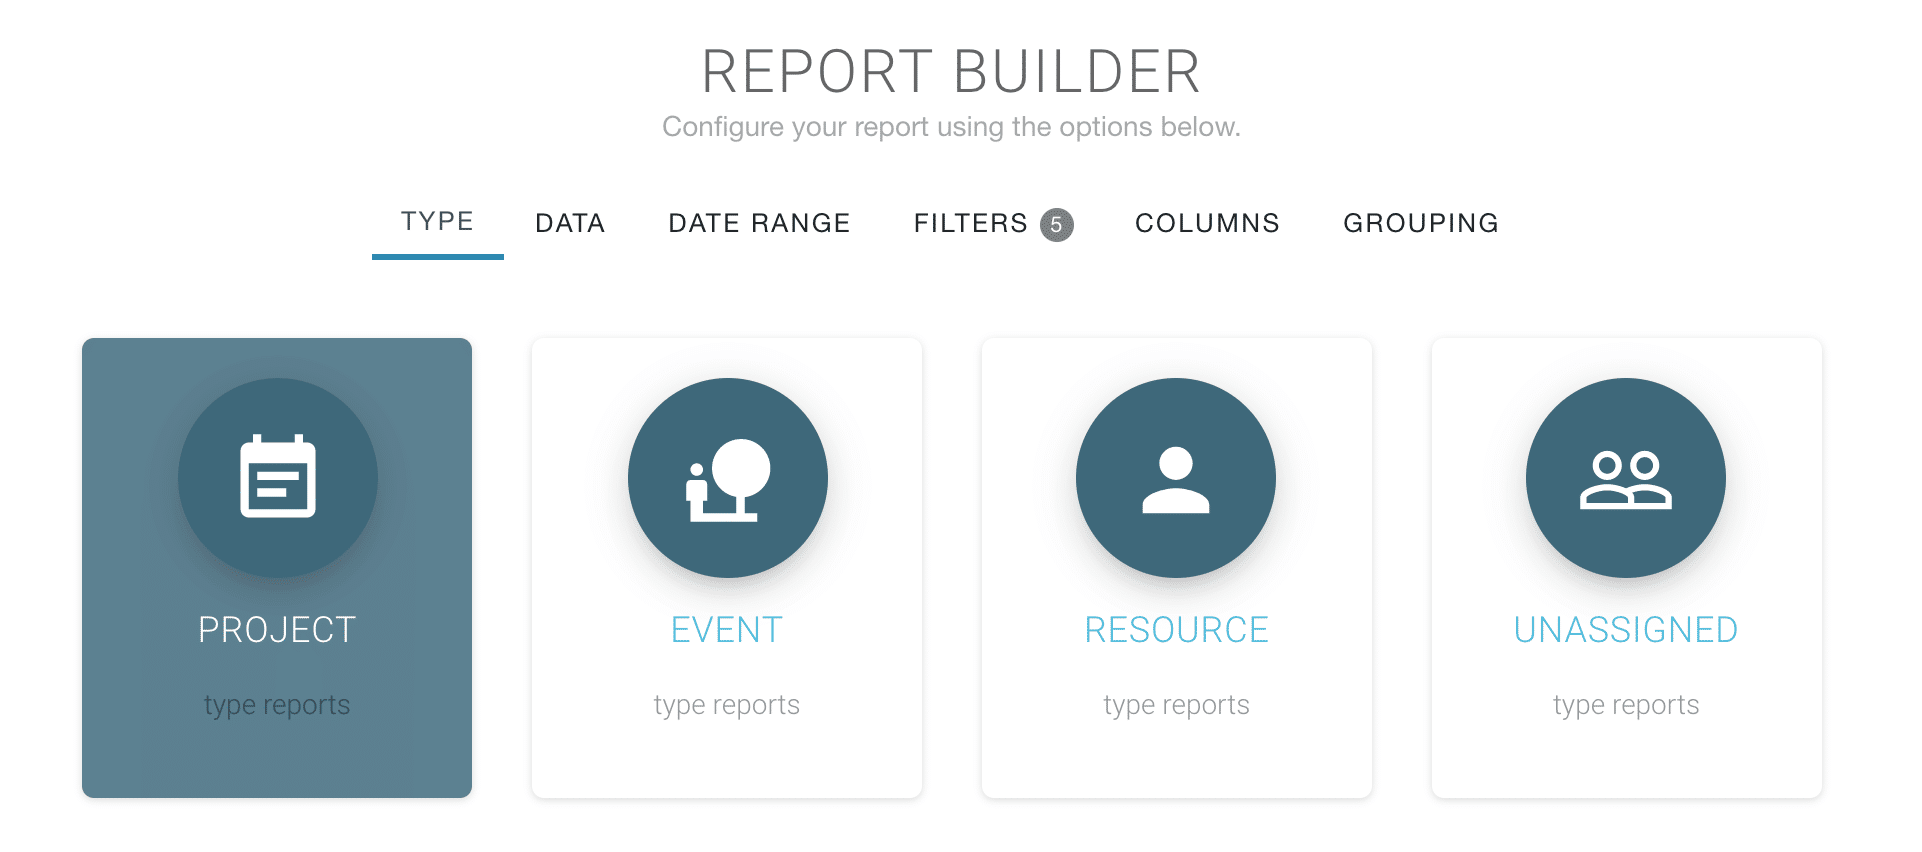
 The filter options otherwise known as the Report Builder are explained extensive detail separately. But let’s give you a quick overview. The Report Builder allows to alter the pre configured templates installed. You can also create a customized report from scratch using the various data options. There are a multitude of options varying from type of projects such as Active, Planned, Archived etc moving on to a
- Date – Another chance to alter the date range of the reports.
- Select Data – Where to obtain the data from Project Groups and or individual Projects.
- Filters – An opportunity to add some extra data or identify by filter specific. Examples include the likes of Booking Categories and Custom Fields.
- Columns – With over 70+ option to choose from. Click on multiple filter to be displayed. Also use the drag and drop facility to organise the layout of the columns. Lastly, directly from the report, expand the column boarders and collapse as necessary to view returned data.
- Grouping – 13 options to group report results by such as Project Manger or Resource Tag. You can also group by Custom Fields.
How to alter the date?
Date – Another chance to alter the date range of the reports. Simply select from the pre filtered drop down options. Alternatively create a customized date from the start and finish fields.

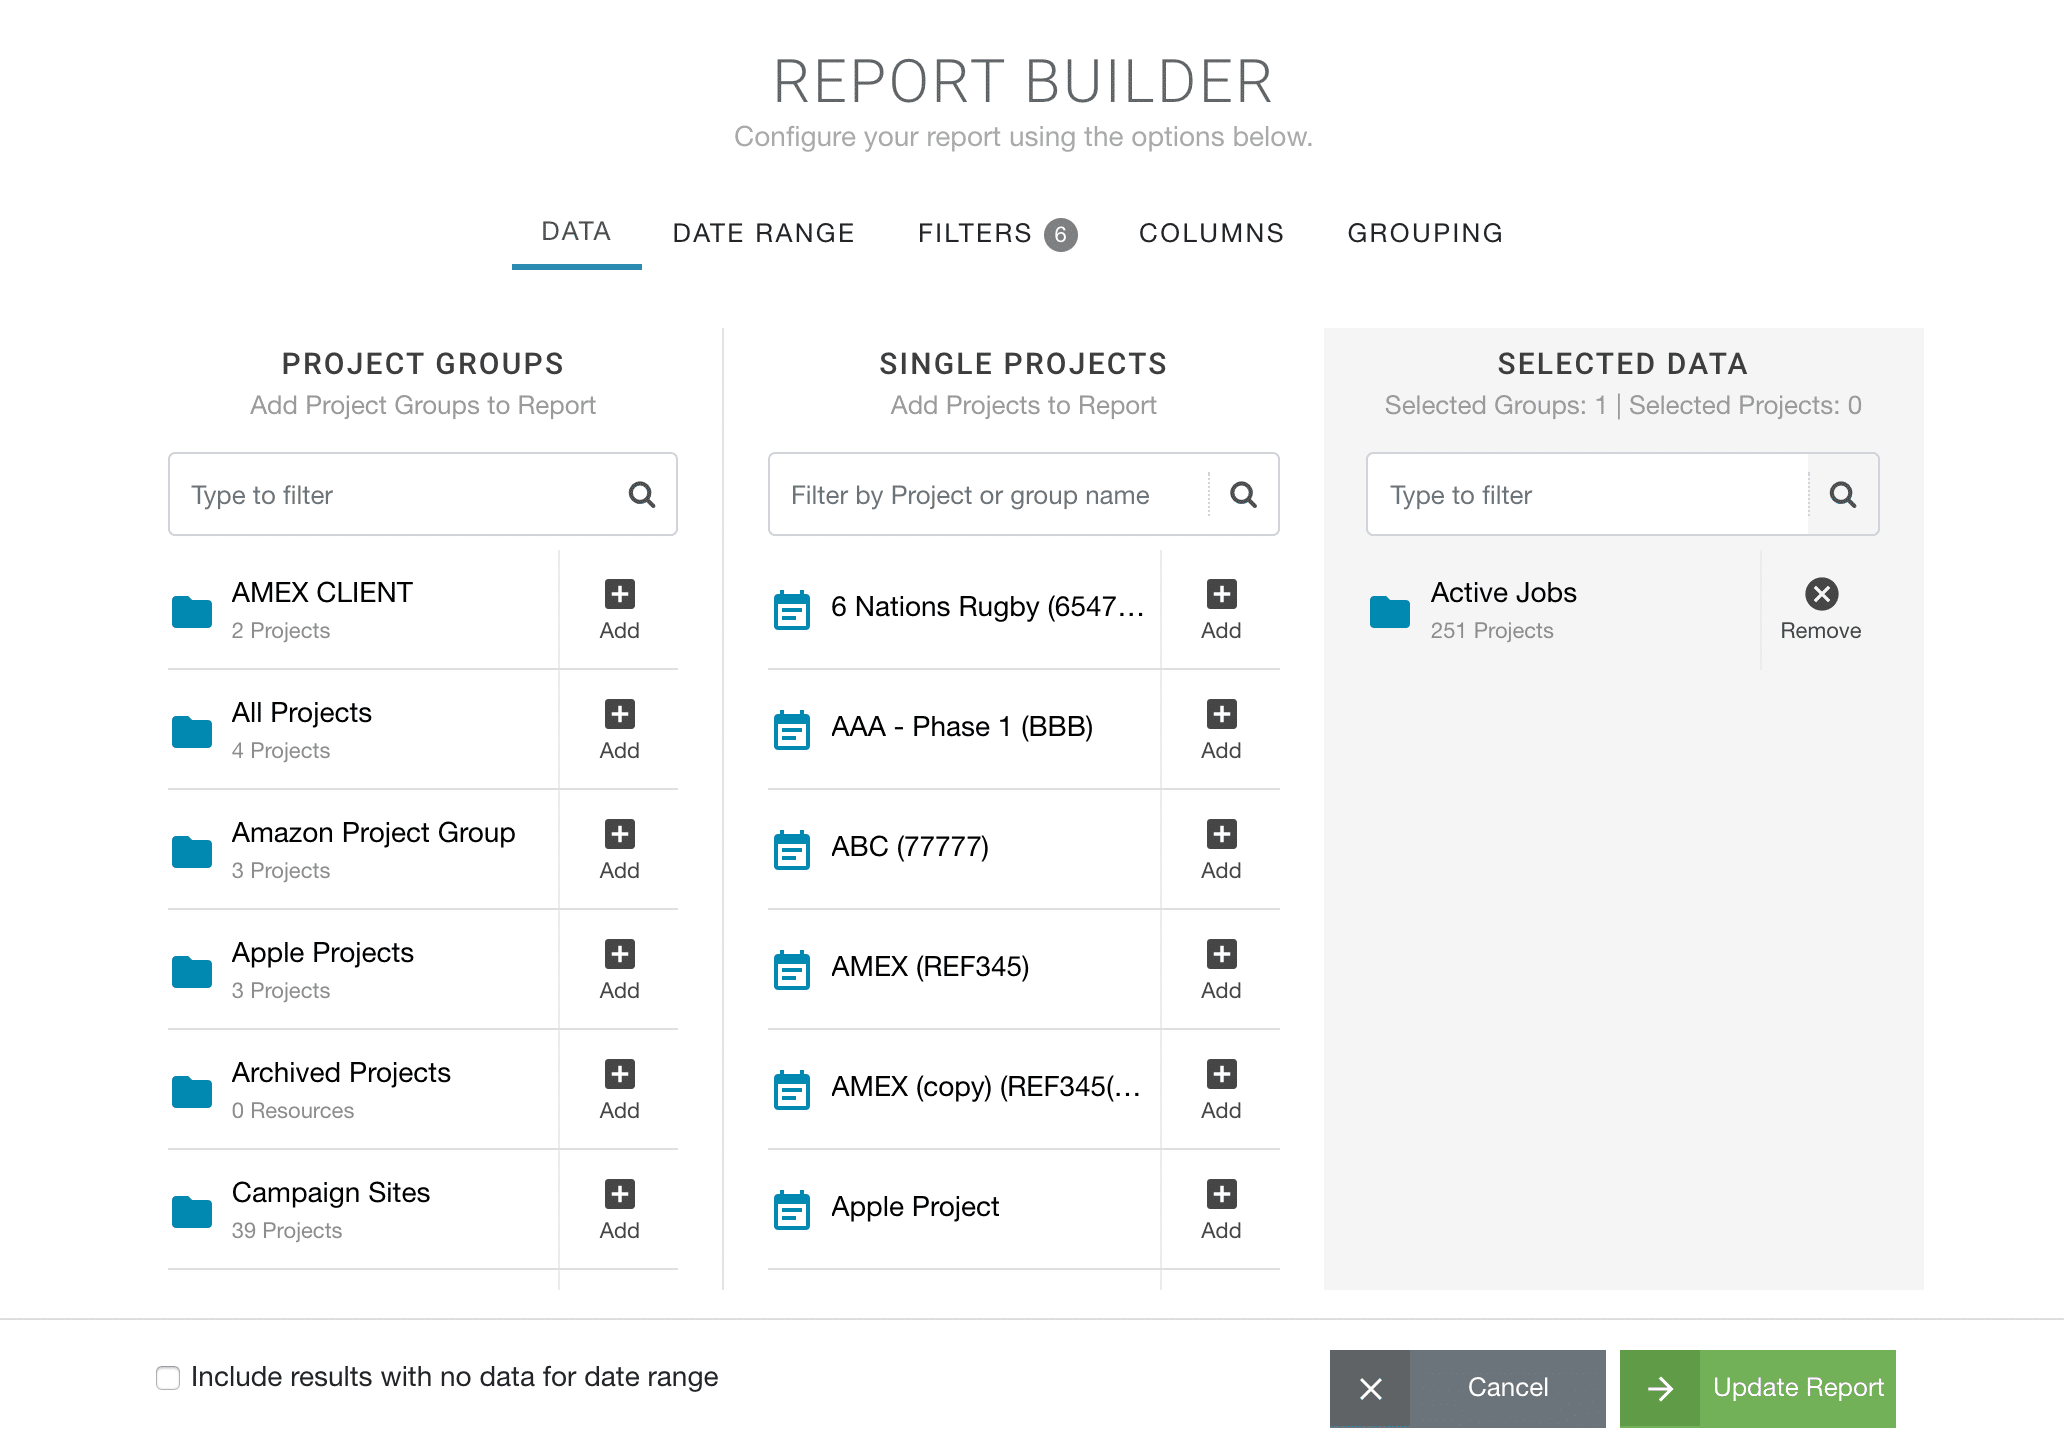
How to select the right data?
Here is your opportunity to alter the choice of projects, events, resources you wish to edit your report to. Editing a project report will natuarlly allow you to alter the project data options such as Project Groups or indeed choosing a single project. Same goes for Resources giving you the option to choose a resource team/ group. Or alternatively narrowing down your search to report on one or more specific resources.
The selected data will automatically have defaulted to the Active Projects or Active Resources. You can opt to remove the Selected Data and begin from scratch or indeed include some more options.
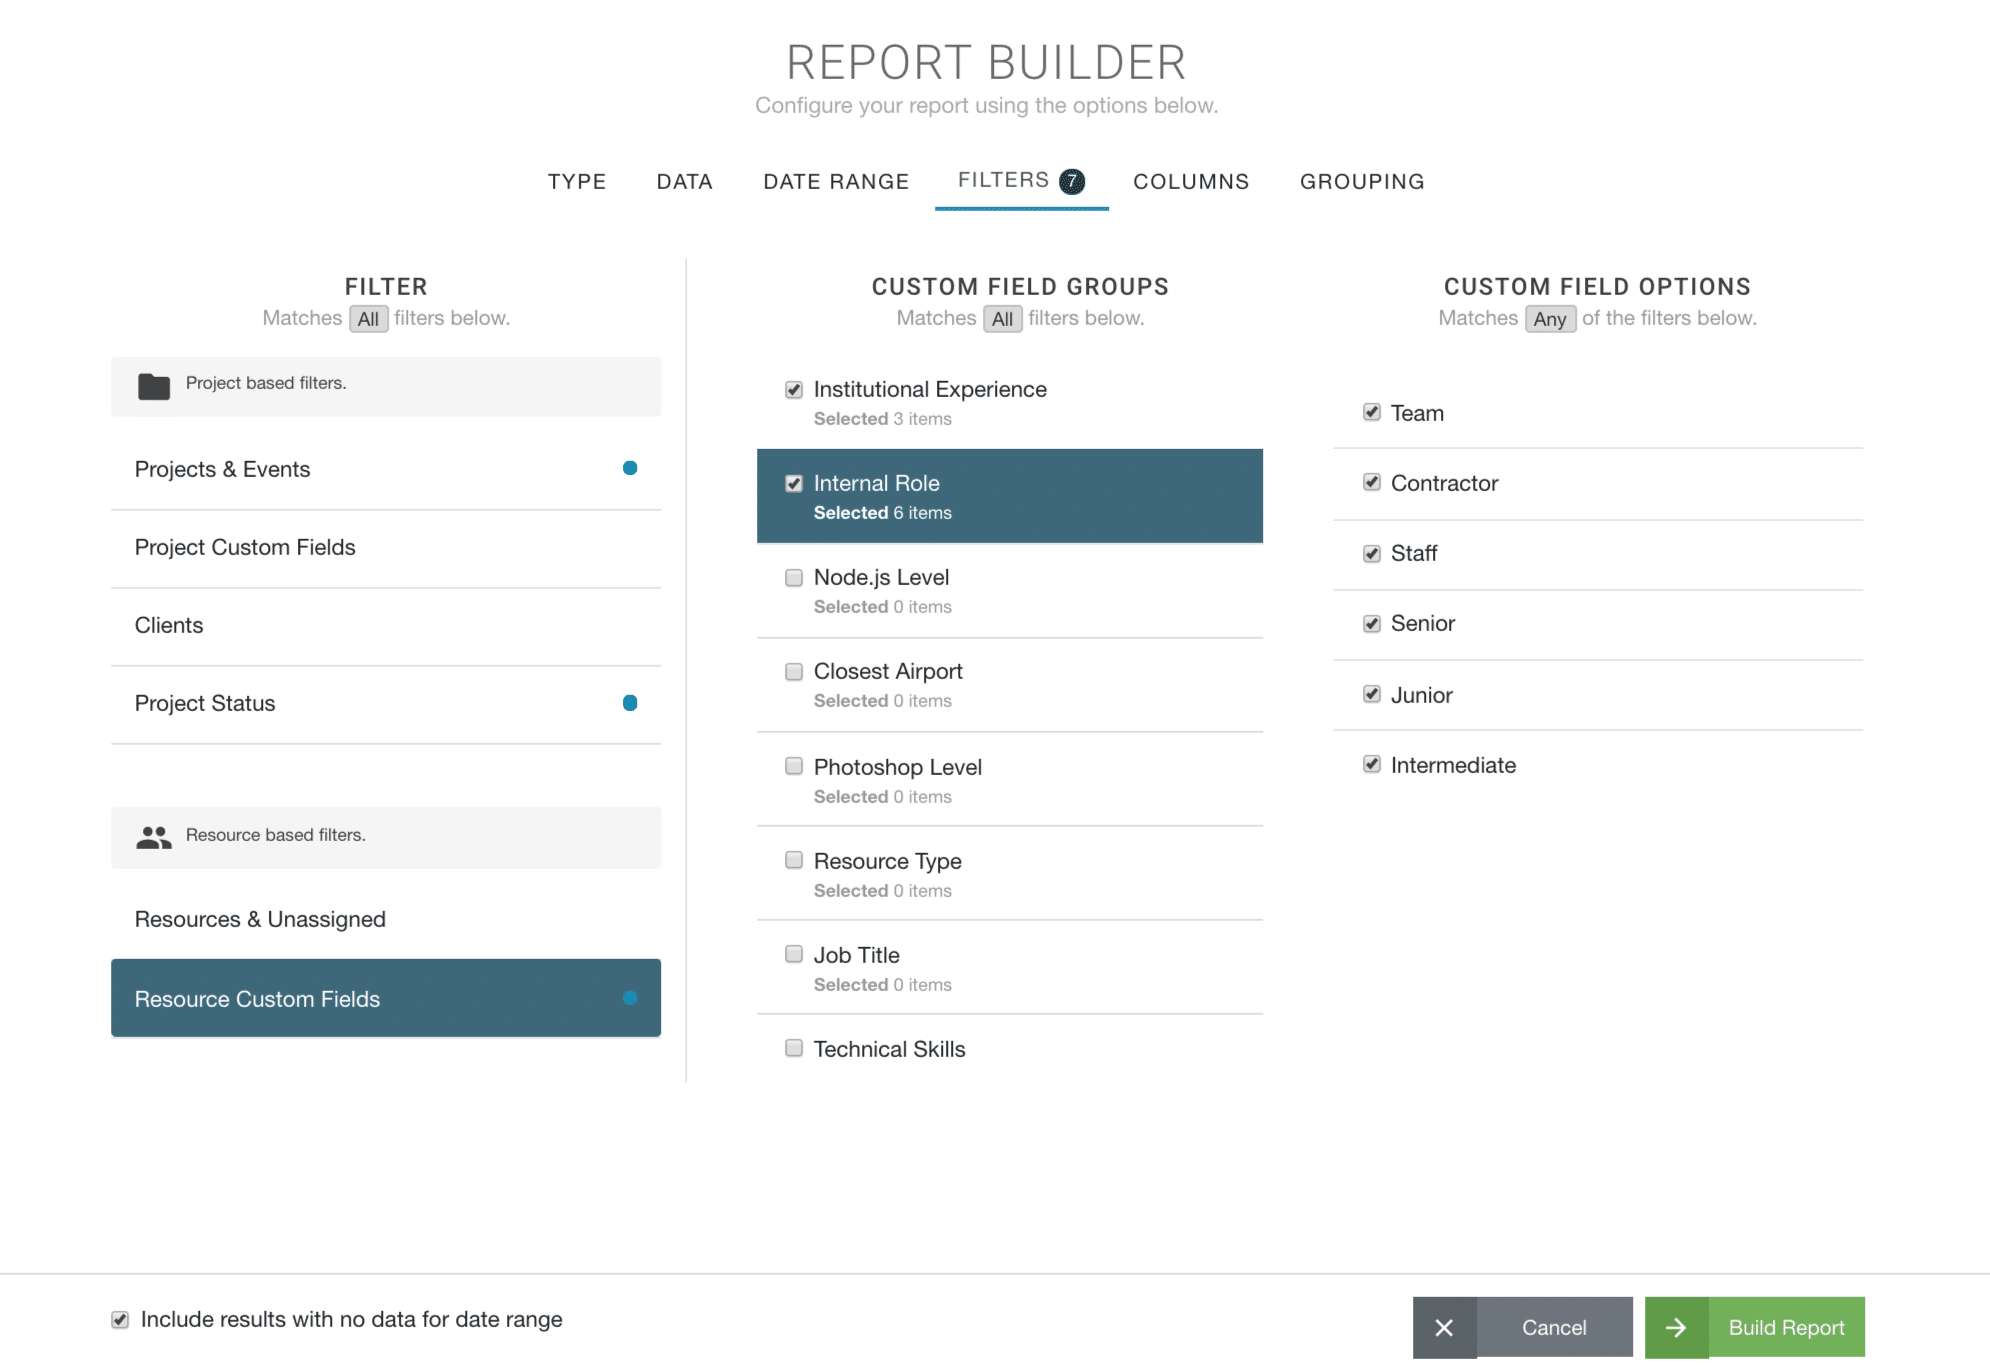
What are the filter options?
Filters – An opportunity to add some extra data or identify by filter specific. Examples include the likes of Booking Categories and Custom Fields. Filter options will vary depending on the data chosen.
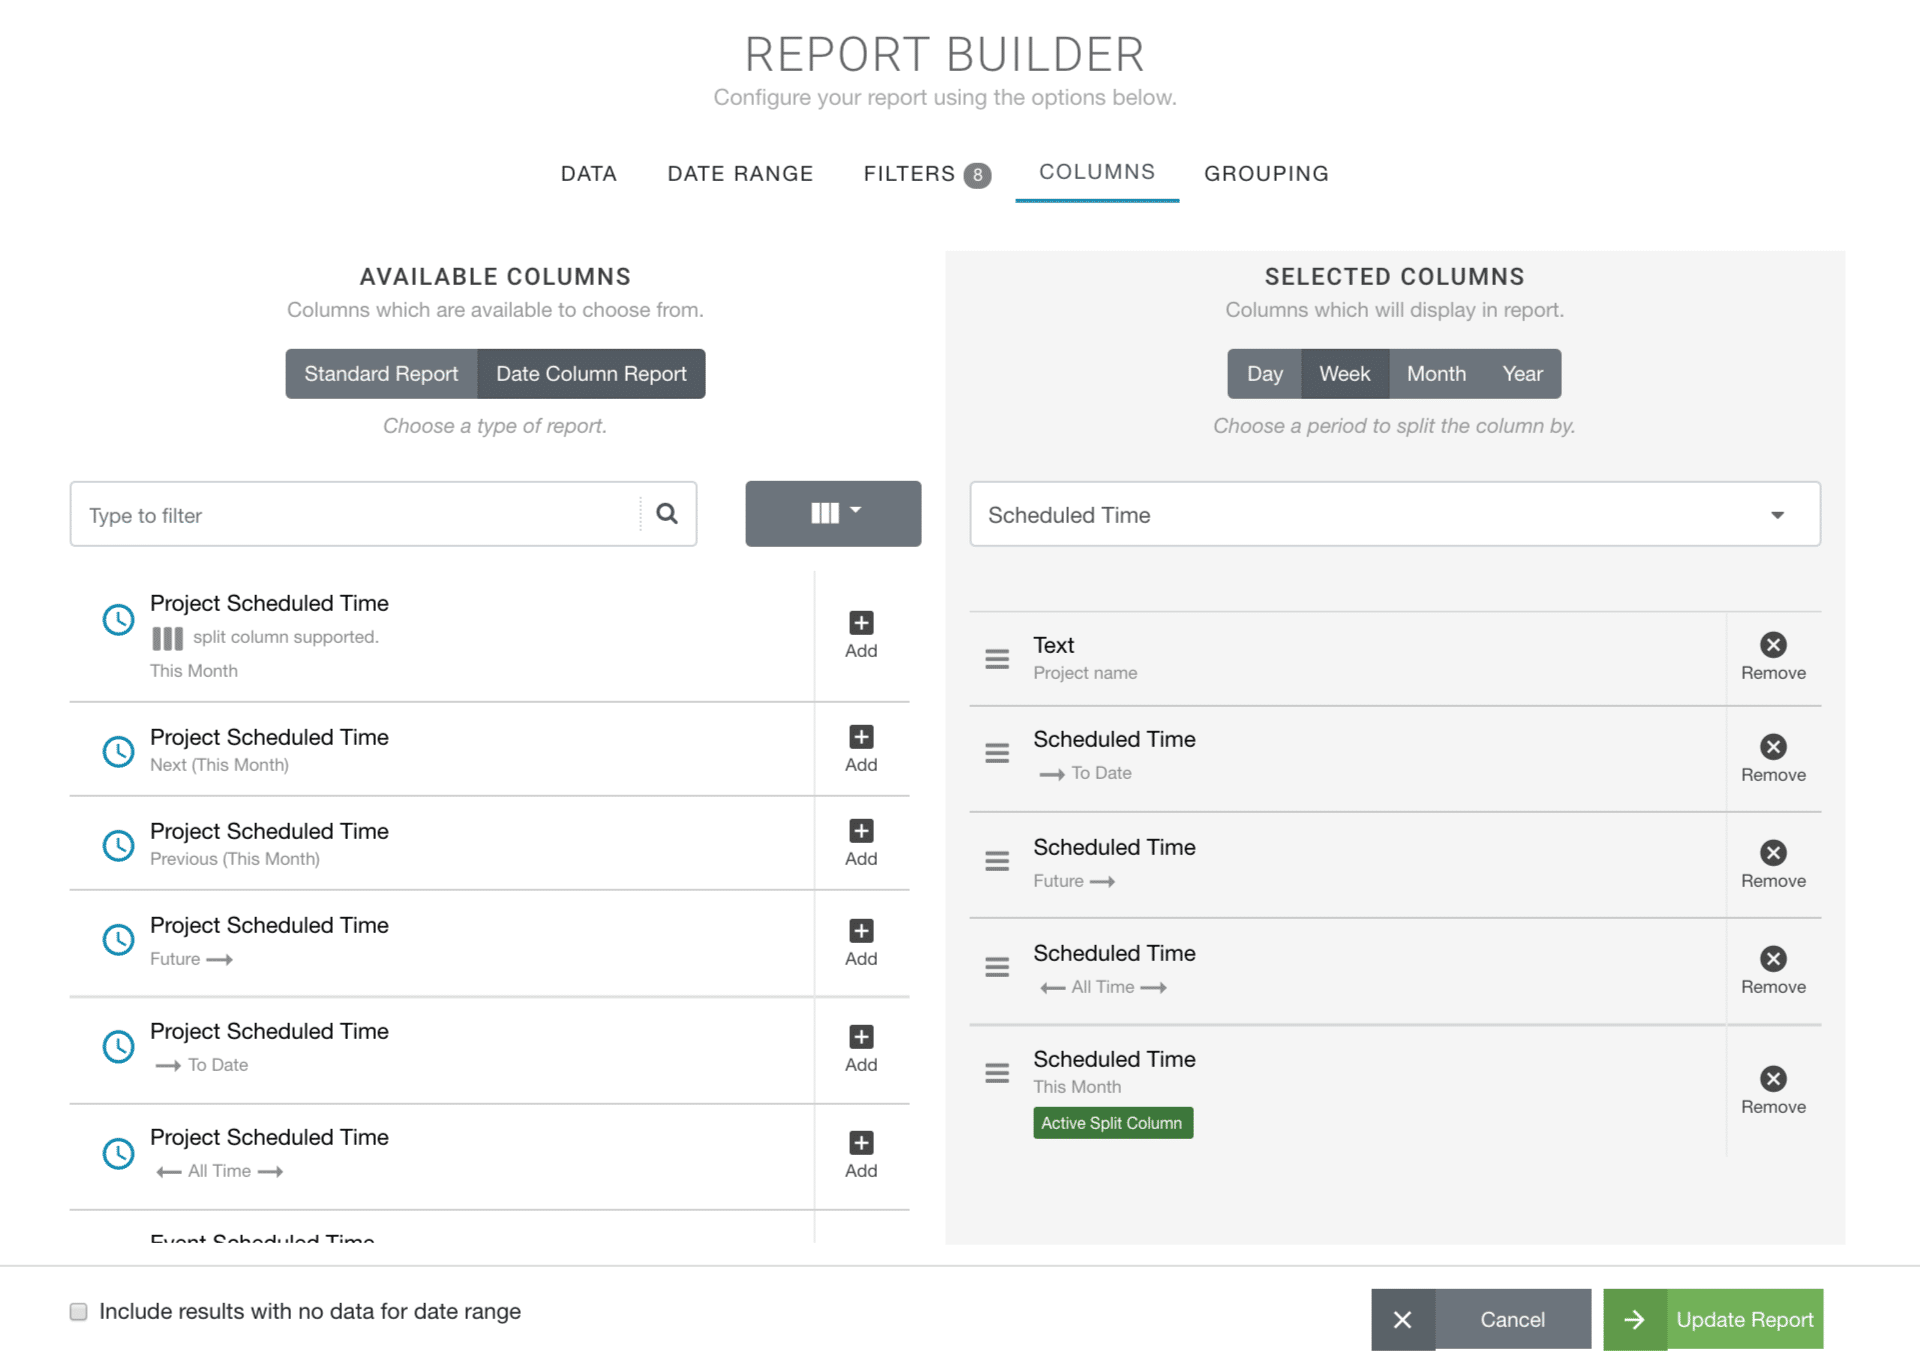
What are the columns options?
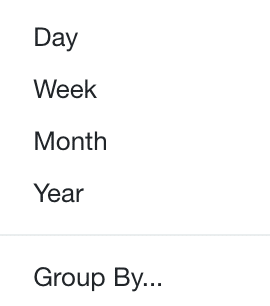
Columns – With over 70+ option to choose from. Click on Dynamic Columns or Date Columns to filter through your column options. Also use the drag and drop facility to organise the layout of the columns. Should you choose ‘Date Columns’ from the available columns options. You can opt to display the results by Day, Week Month and Year. Drag and drop the order in which you wish for the columns to display the data.
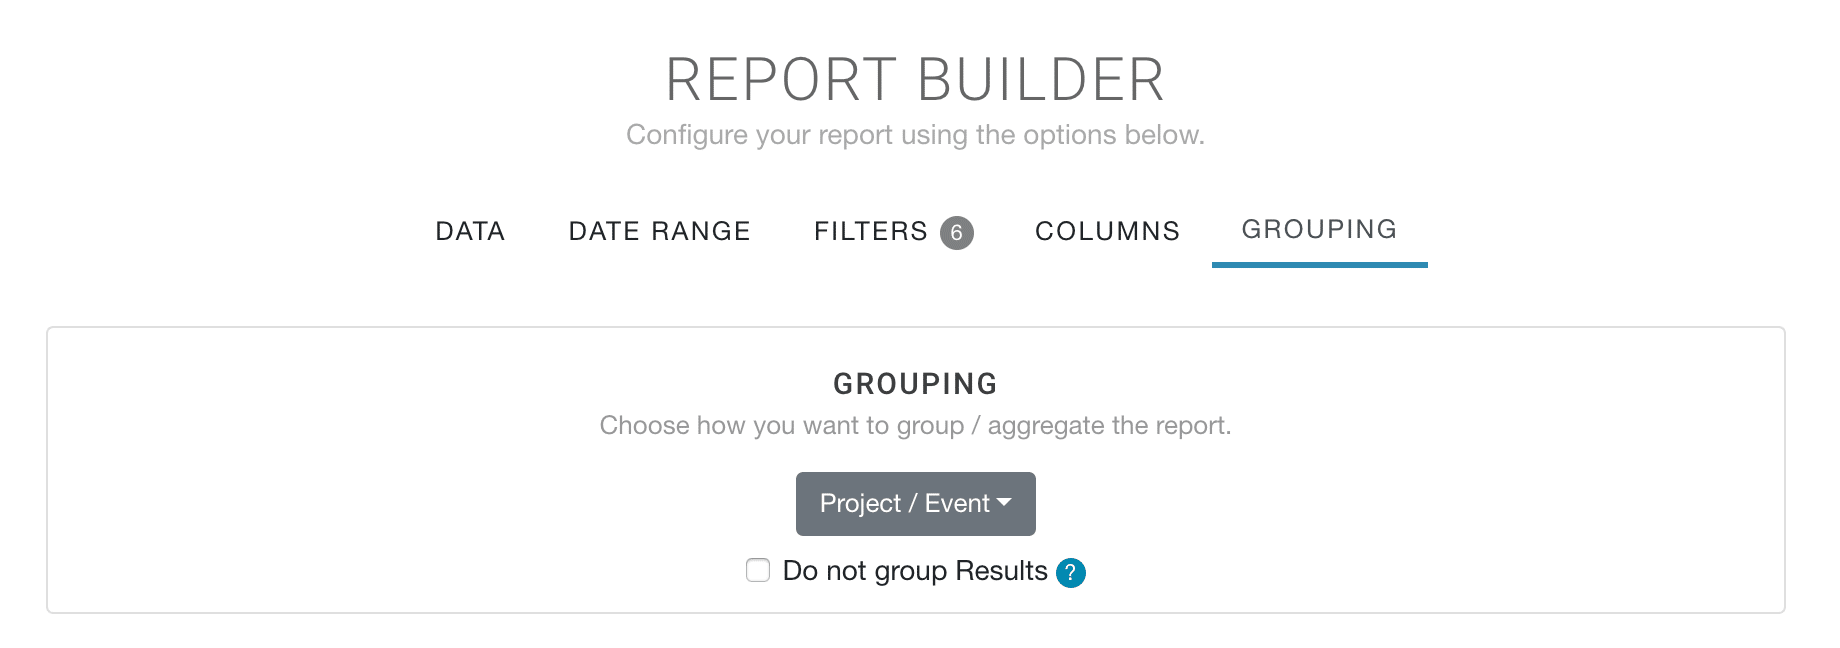
How do I group?
The last option on columns is how you wish the data to be grouped by. There are multiple options for you to choose from including dates and custom fields.
Do Not Group Results
You also have the option to not group results. What does this mean? This means that you can view the raw line item data of the report. This will remove the levels and filters assigned to the template. Suggest that you add in some columns relevant to the report data. There is a full section on Non-Grouped Rows where you will find subsequent information.
Whats the best way to share reports?
There are a couple of options available to you here. All direct options from the Report Toolbar. Firstly, you can access a unique URL from the SHARE icon. Copy the URL and share as you please via Slack / IM or email. You could also download as a PDF or alternative file type and share accordingly.
Another option is to save the report and share via the Internal Reports folder. Access to the Internal Reports folder is located on the Reports Home Page.
Can make changes to the Templates and save them?
Absolutely, to make changes to a template all you need to do is click on the filter settings cog where the Report Builder modal emerges. Click generate to make the changes to the reports.
Subsequently, to save the report follow these steps:
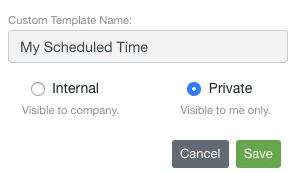
 Click “SAVE” from the report toolbar.
- Edit the report name if required.
- Opt to make access ‘Internal’ to your colleagues or privately just for your own perusal.
- Internal will save to ‘Internal Reports’ icon within the home page.
- Private will save to ‘My Saved Reports’ icon within the home page.
 Click “SAVE” from the report toolbar.
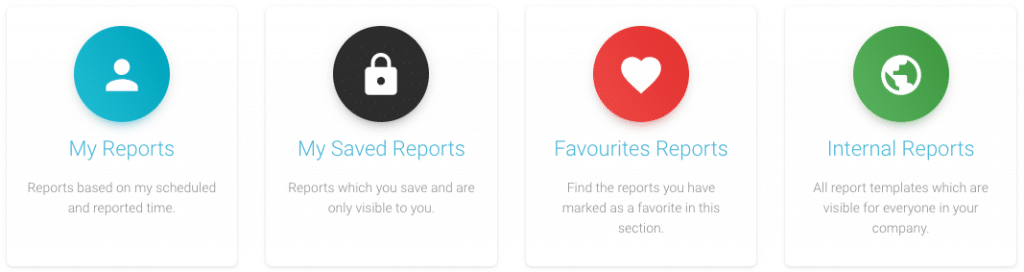
Can I download a report?
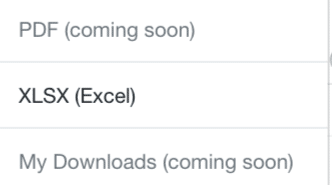 Indeed you can. Within the toolbar click the Download Icon. A module will open for you to select the format of the report. Excel is the current option. Coming soon are options for PDF and .to save to ‘My Downloads’ folder.
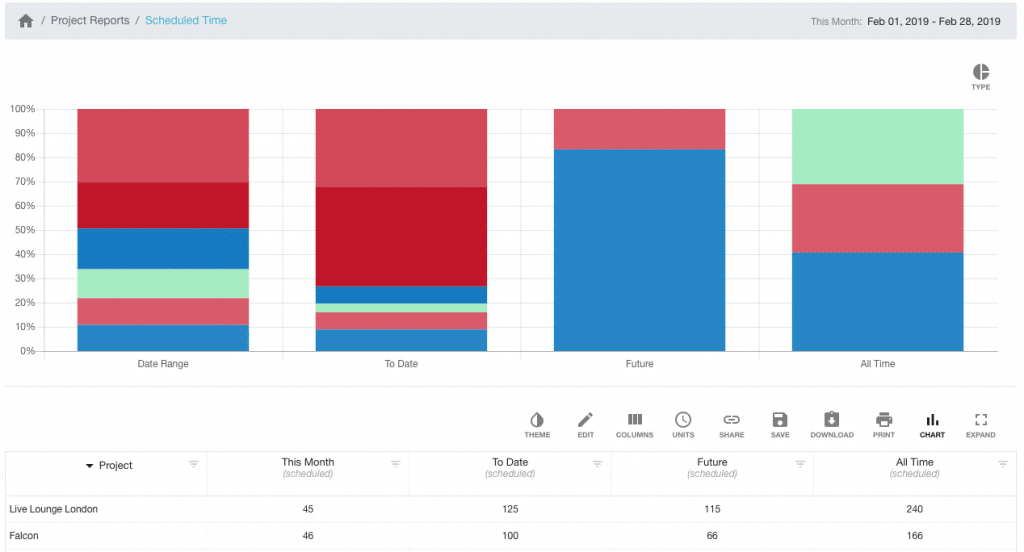
How to view reports by Chart?
Via the report toolbar, click on Charts. Your corresponding report data will appear at the top of the screen with the original format based below. There is a Chart Toolbar which provides you with some options to alter the way results can be displayed and filtered. You have the same options to download, print and share with the chart included in the report.
- Color – Alter the shade and contrast of colors that display report results
- Y- Axis – Change the measurement unit that is displayed in the Y Axis (Time, Spend or Percentage)
- Data – Select the amount of data you wish to display. Depending on the report chosen variances will apply. For example, Scheduled Project Time. Variables available are as follows:
- This Month
- To Date
- All Time
- Future
- Type – Choose the style of chart that produces data (Column Chart, Line Chart and a Stacked Column Chart)
Another Chart Example:

Report Chart Toolbar

COLOR

Y-AXIS

DATA

TYPE

How does Expand work?
Expand removes the sidebar and creates the report into a full screen mode.
Options
 By clicking options, a subsequent drop down appears with extended feature options.
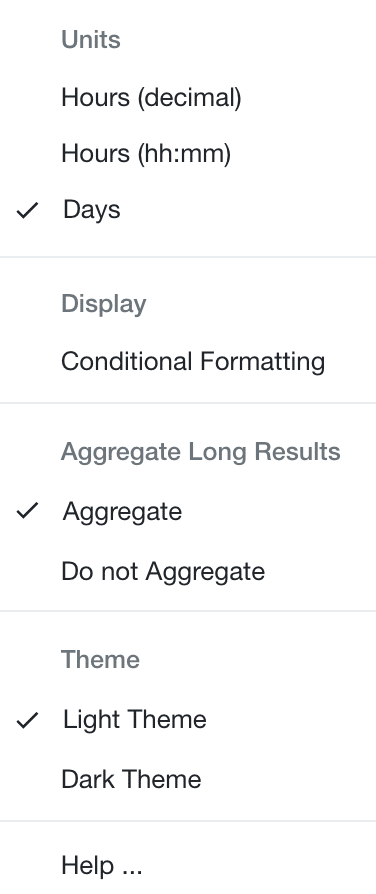
Access to alter the following features:
- Units – Alter between the untis of report time
- Display – Add Conditional Formatting to the report
- Aggregrate Long Results – Condence or expand aggregrate report results
- Theme – Switch between Dark and Light mode
- Help – Link to Reports Knowledge Base
Can make changes to the units of time is displayed?
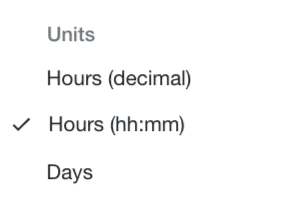 You have 3 options to the way to display the time of returned report data. Using the report toolbar, from Options click on UNITS. From here select from either of the following options:
- Hours decimal
- Hours hh:mm
- Days
Easy to readjust accordingly giving you the ease of alternating through the options.
Formatting Reports
 Activate Conditional Formatting by selecting the option.
For more information on how to get the best out of Conditional Formatting. ‘Work Smarter with Conditional Formatting‘
How do I access the Dark Mode within the Report Toolbar?
 Change from default light mode to dark mode to create a dark aesthetic perfect for better focus and contrast. To enable Dark Mode, you need to navigate to a report. For example, from the Report home page. Click on Project Reports followed by Scheduled Time. Now the report toolbar is visible to you.
Click on the ‘Options’ icon within the report toolbar to activate the dropdown list. Under ‘Theme’, select Light Mode or Dark Mode. Want to switch back? No problem, just follow the same process as above.
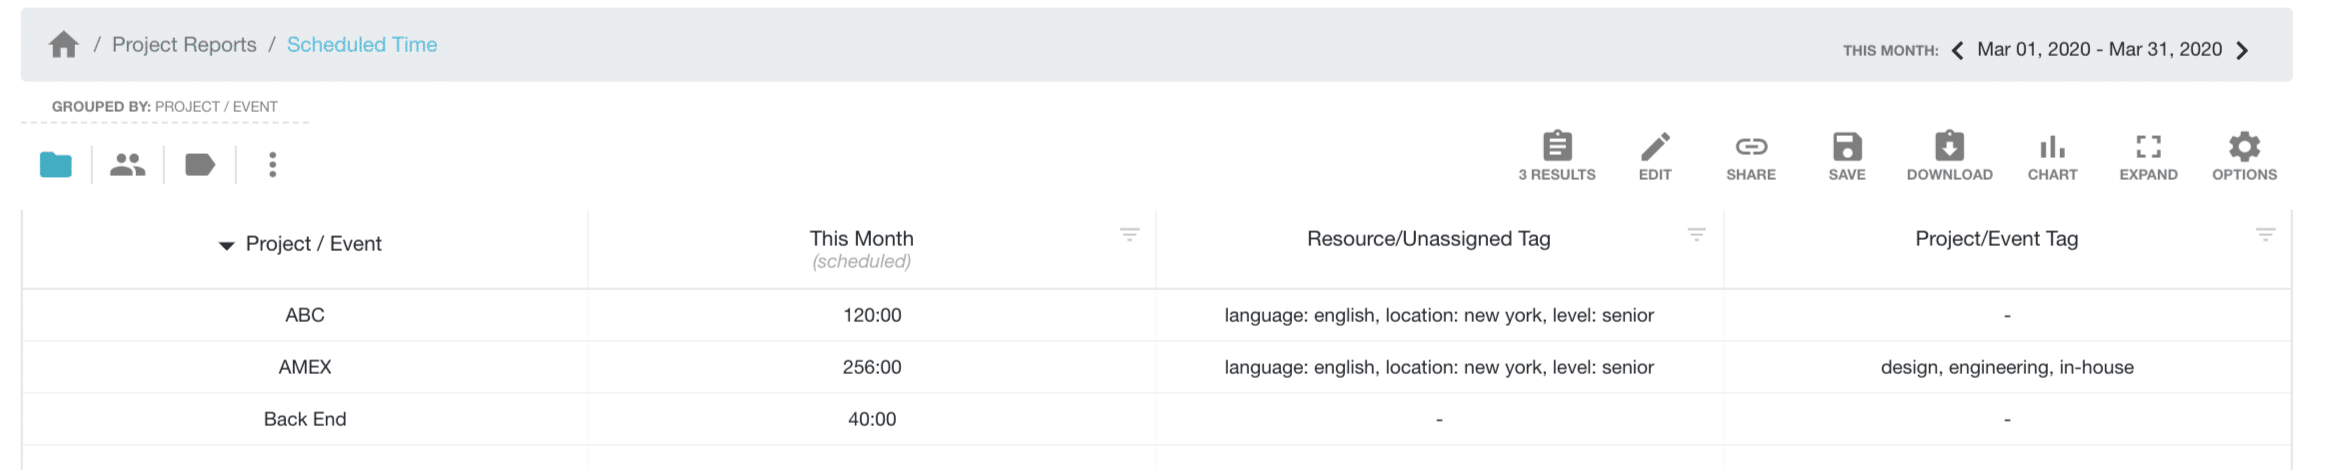
Aggregate Long Results
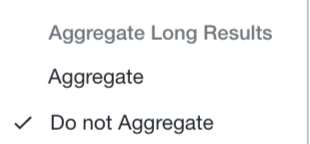 Defaulted to Aggregate results, feel free to change this. Using the option to not aggregate results will allow you to see more data within the cell. Expand the cell boarder accorindlgy to view data. Note, any results that contains more than 3 options within the cell will aggregate results. Bear in mind there is a tooltip that will appear to show you the content of the aggregated cell.
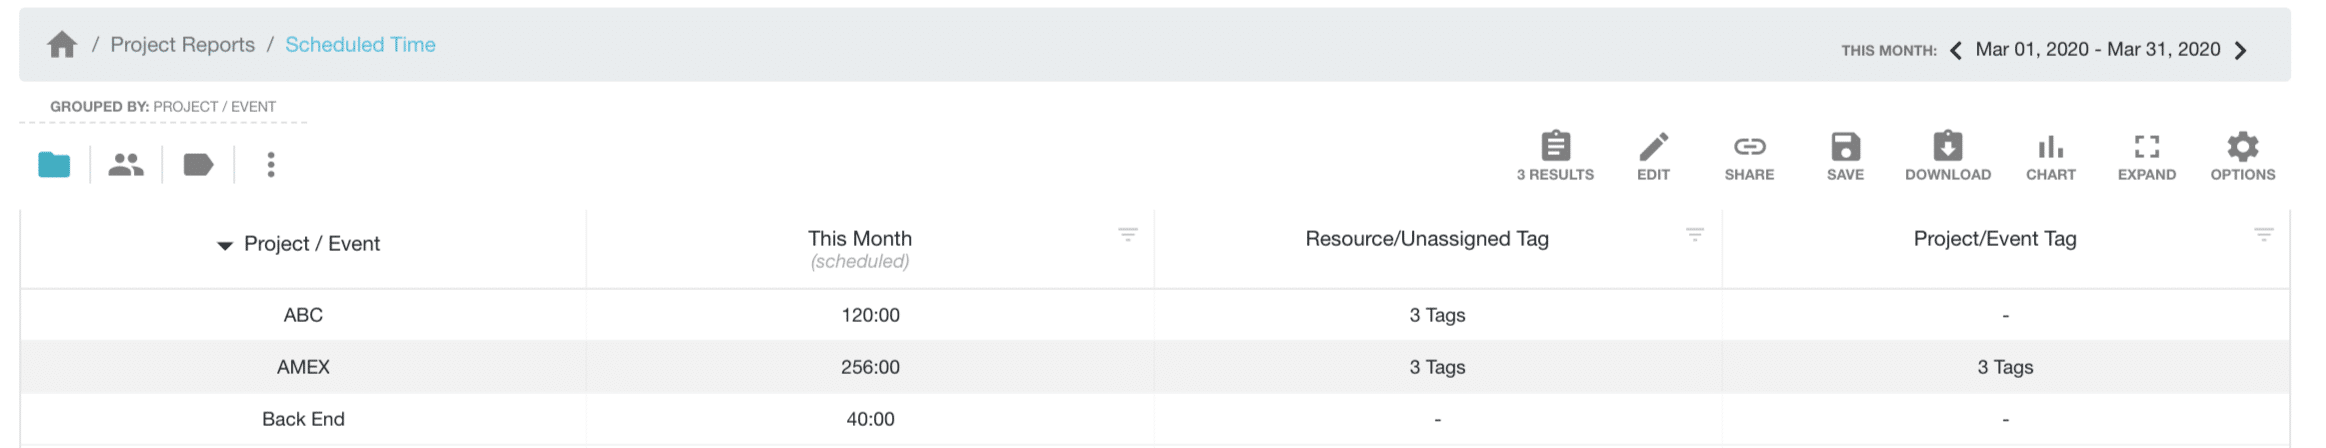
After aggregating results:
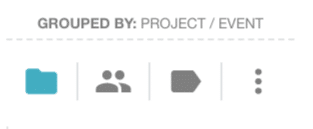
Predefined Report Grouping Buttons
For quick access into different aspects of the report. Select one of the pre defined groupings from the Report Toolbar. An alternative to navigating to the report builder to edit a report, we’ve created this quick trigger access for you.
We’ve picked some of the most popular report groupings and created these quick access buttons for you.
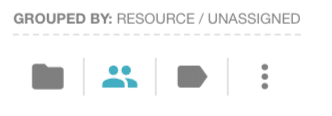
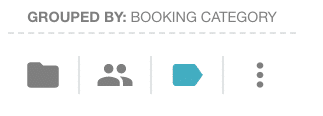
What are the predefined grouping buttons?
 1 – Project/Event
2 – Resource
3 – Booking Category
4 – Date (further Drop Down to choose date freguency and access to Grouping tab within the report builder)
See below example of Project Scheduled Time. By clicking the grouing buttong for Resource. The report is automatically filtered to show results by Resource.
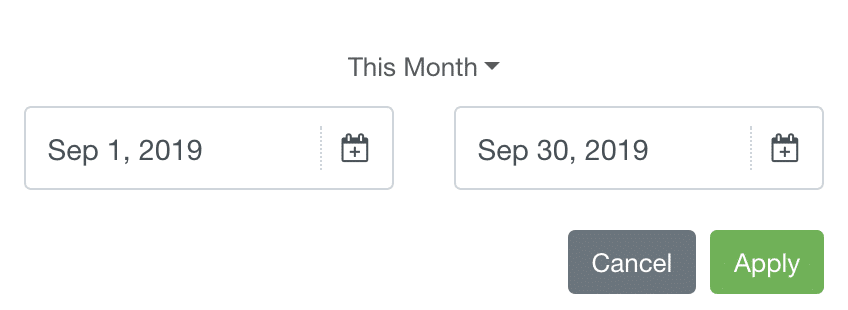
How to generate reports of different date ranges?
Defaulted to the current month, simply alter the date fields together with any other filter settings you need and generate as necessary. There are numerous pre filtered date range options. You also have the option to create your own custom date range.

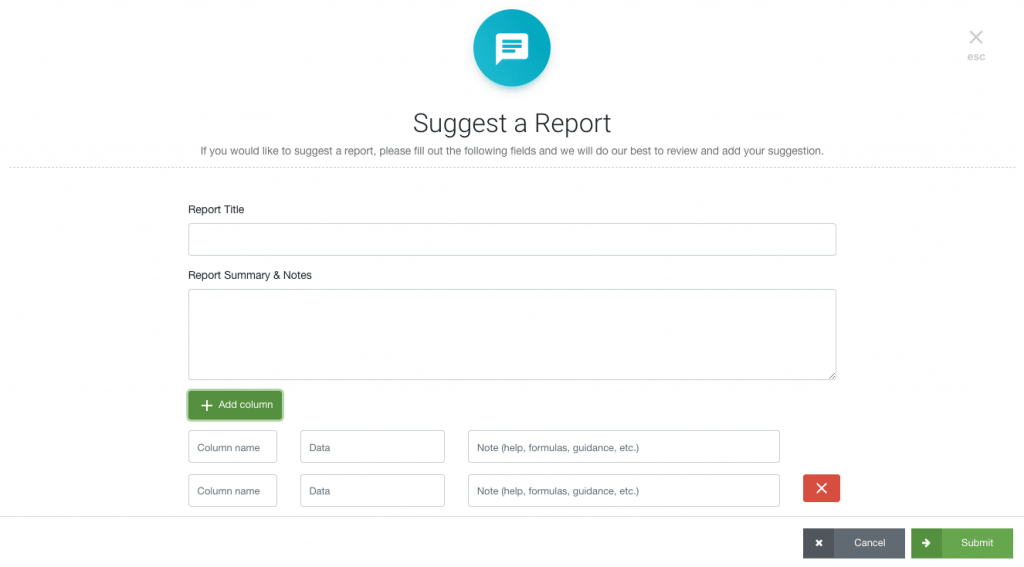
Suggest a Report
Have you created a customized report template that you think other users would benefit from? We have a template which you can submit your prosed ideas. Send on your suggestion to see it as a pre configured template on the home page.