Team Dashboard Pro
FOR THE ULTIMATE TEAM & PROJECT MANAGEMENT EXPERIENCE
Enhance and scale the functionality of the Dashboard by installing the premium extension Team Dashboard Pro.
Dashboard Pro provides enhanced features and functions of the Dashboard providing the ultimate team experience and usability.
Project & Team Dashboard
PROJECT AND RESOURCE TIME, SCHEDULE AND UTILIZATION.
The Team Dashboard Pro is a Premium Extension of Hub Planner Dashboard. Installing the Team Dashboard Pro provides an upgraded experience with extended functionality to the dashboard. This will be of particular interest to those looking to view Project Specific Dashboards, Team Resources & Group Dashboards. The Team Dashboard Pro is a paid extension and can easily be added to your account via the Extensions page.
You will find similarities between both Dashboard interfaces, but the pro version add’s so much more functionality and usability for the ultimate team management experience.
Multifunctional Dashboard
PROJECT AND RESOURCE TIME, SCHEDULE AND UTILIZATION.
- Get a breakdown of your data impact on Projects in a Dashboard
- View Dashboards of a combined group of Projects
- Dashboards of Resource Teams as a whole
- Additional Inline Tabs for more information
- Dynamic sidebar for navigating and selecting data
- View the Timeline of Schedule
- Utilization rates for Resources time on projects
- Deep dive into any team members dashboard
- Deep dive into any single project or project group
- Completely integrated with Role Rights, Permissions and Reports
Dashboard Pro Types
If you would like to enhance the functionality of your Dashboard for a wider team based Project Management, then the Team Dashboard Pro is the solution. You can activate this extension and get access to more than just your own Dashboard. The 4 Additional Dashboards Available Are:
Dashboard Pro Analytics
Make better forecasting and planning decisions based on the Team Dashboard Pro analytics. Dashboard Pro analytics are represented in varying pods and silos of data. Each dashboard type, will determine what data analytics are displayed. Choose from the varying date ranges options to view the Dashboard Pro analytics over different time periods.
Inline Tabs
Dashboard Pro functionality extends with inline tabs detailing further data analytics of the project, resource, project group or team. Such data includes the timeline of the project or resource team schedule, the utilization rates of resources over different time periods. You also have data tabs details further information about the project and associated tasks.


The Project Dashboard
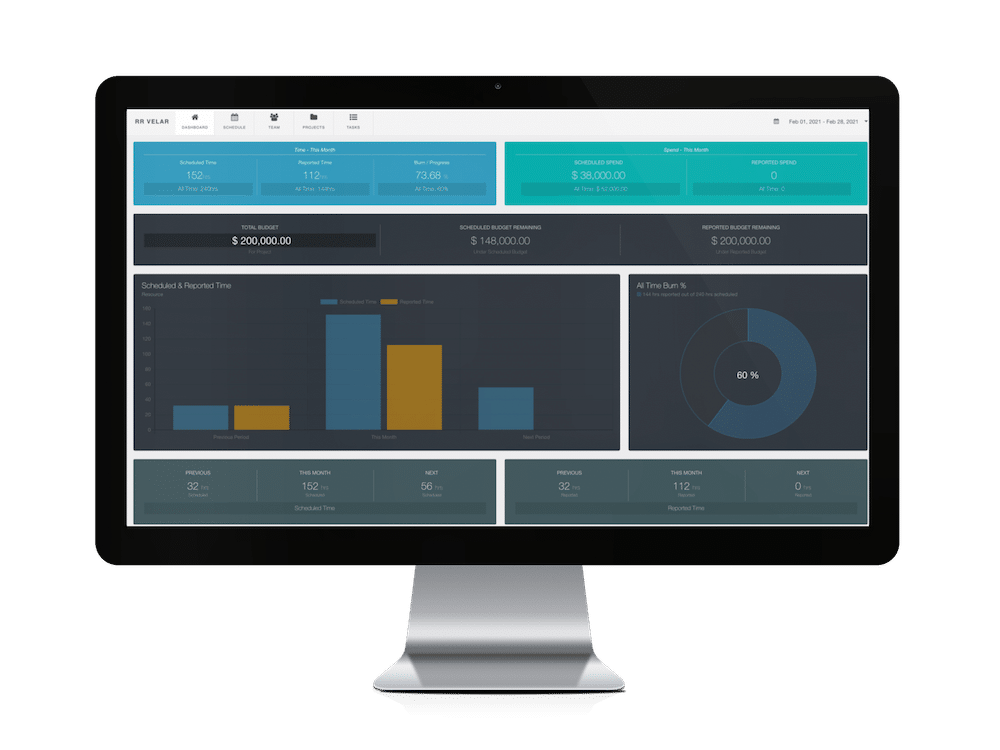
VIEW PROJECT TIME, SPEND, BUDGET AND BURN RATES ON THE ONE PAGE
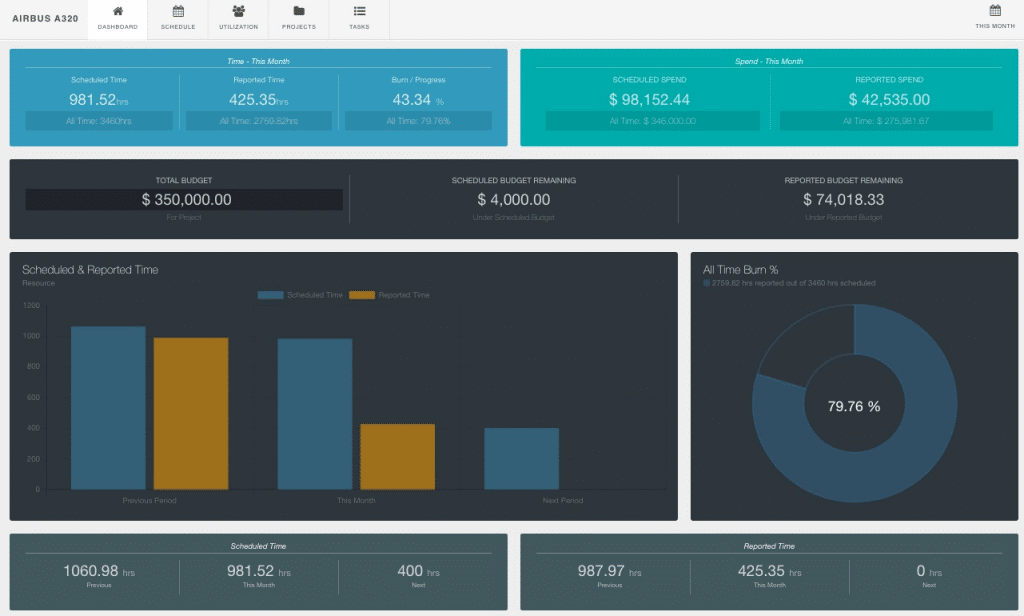
The homepage of the project. Providing you with an illustrative, birds eye view of all the high level need to know project stats including: time, spend, budget, scheduled v actuals and burn rate. Each in a pod of their own detailing the topic in more depth. Use the date picker to switch and view data against different date ranges. The Project Dashboard contains 5 inline tabs showing project details like the schedule, utilization rates, etc.
The Resource Dashboard
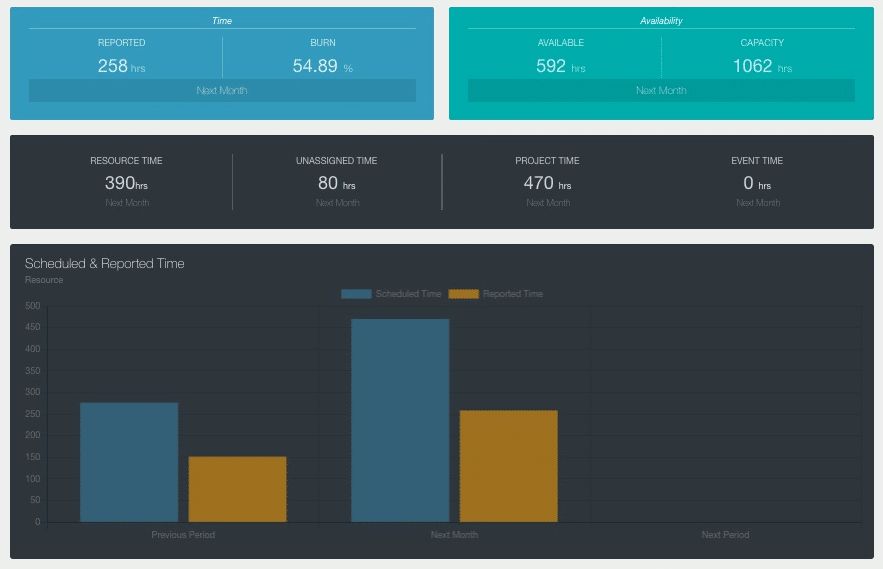
COMPARE SCHEDULED V REPORTED TIME OVER DIFFERENT TIME PERIODS
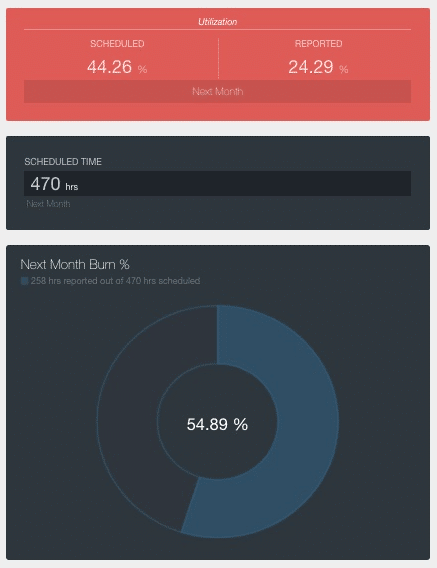
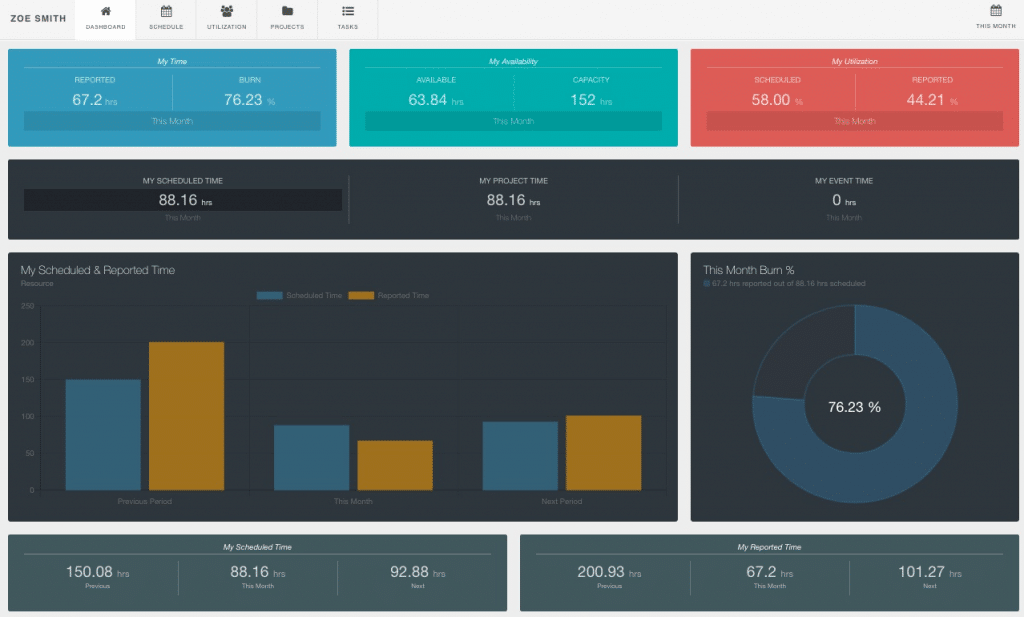
Whether you view a single resource or a resource group, view real time data of time, availability and utilization. Smartly condensed pods and graphs of information give you a quick glance of key data. Resource time displayed in easy to view and read charts allowing you to quickly identify and compare scheduled versus actuals. Pick a date range to compare and contrast over different time periods. The inline tabs help to detail the resource schedule timeline, their utlliization rate, project data and the task backlog.
The Project Group Dashboard
VIEW PROJECT TIME, SPEND, BUDGET AND BURN RATES OF PROJECT GROUP
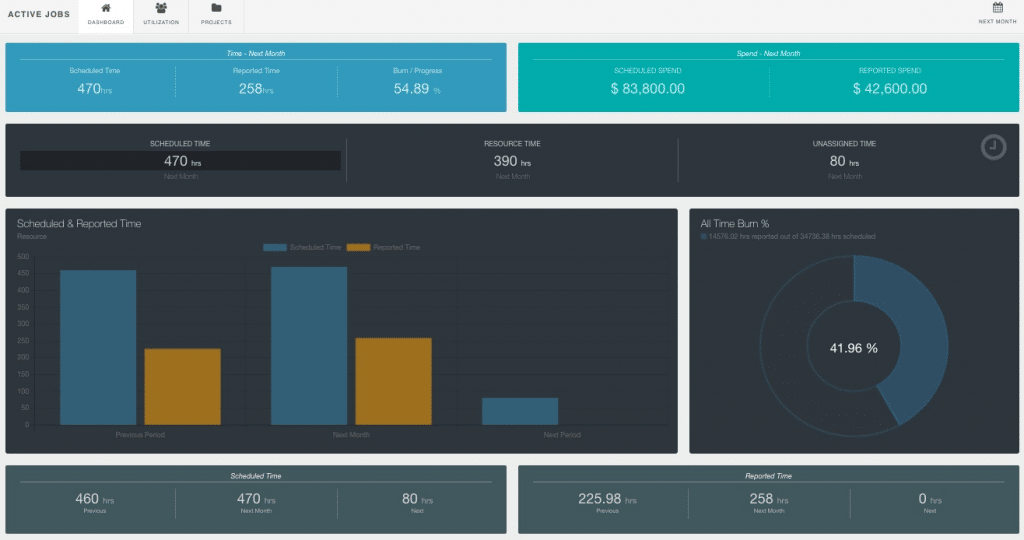
The Dashboard Pro sidebar allows you to pick and choose from a single project view or indeed a project group view. The Project Group dashboard will display real time analytics around time and spend. Displaying scheduled and reported time as well as project spend as a project group over different time periods.
The Project Group Dashboard contains three inline tabs showing project details like the schedule timeline of resources working on projects within the group. It also displays the utilization rates of all resource that are working on projects within the project group. Then lastly, detailing the each of the single project data stats.
The Resource Team Dashboard
VIEW THE WHOLE TEAM KEY METRICS DASHBOARD ANALYTICS
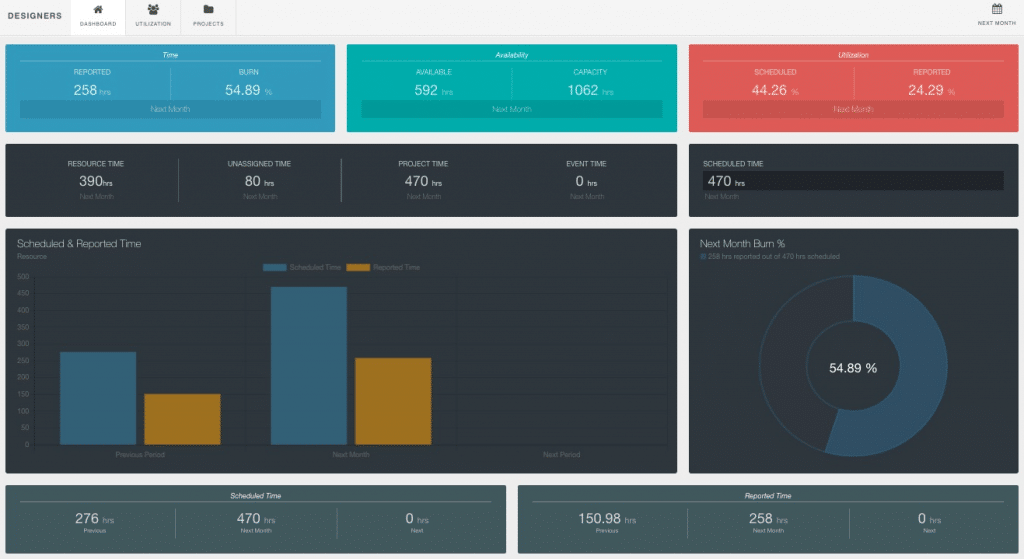
Dashboard Pro allows you to view two variations of resource data. Single Resource and Resource Groups or teams. Use the sidebar to navigate to view a single user or team of resources. The Team Dashboard Pro allows you to view all team key analytics on the one page. Detailing the resource teams scheduled and reported time in multiple formalities. Also showcasing the availability, capacity and utilization rates of a team as a whole, really provides those high level team stats. There are 2 corresponding tabs that will detail the Utilization rates of the resource or team as well as the projects they are a part of. Use the date picker to switch and view data against different date ranges.

Schedule Timeline
SCROLL THE TIMELINE OF PROJECT SCHEDULED TIME
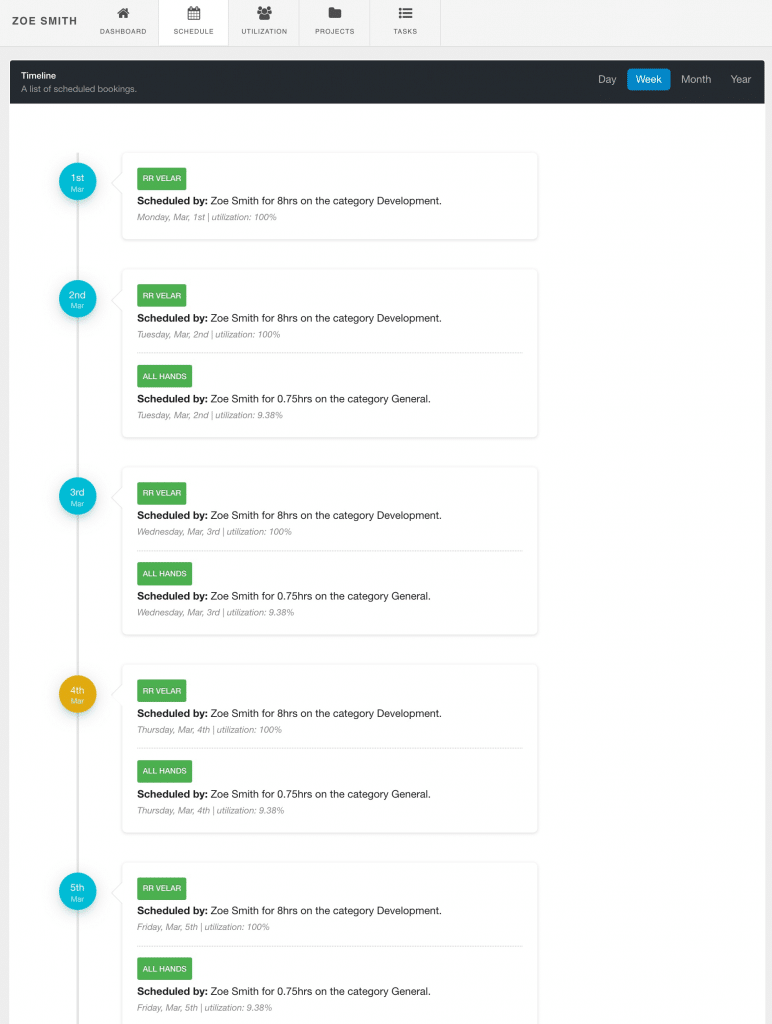
The schedule layout provides you with a day by day breakdown of project resource time scheduled. Select a date range option from either:
- This Week
- This Month
- Next Week
- Next Month
Who’s working on what? What booking category has been assigned? The scheduled booking details will show:
- Resource Name
- Creator of Booking details
- Booking Category assigned
- Allocation time in hours
- Day and date.
Utilization
EASILY VIEW RESOURCE UTILIZATION RATES AGAINST THE PROJECT IN A QUICK SNIPPET DASHBOARD VIEW
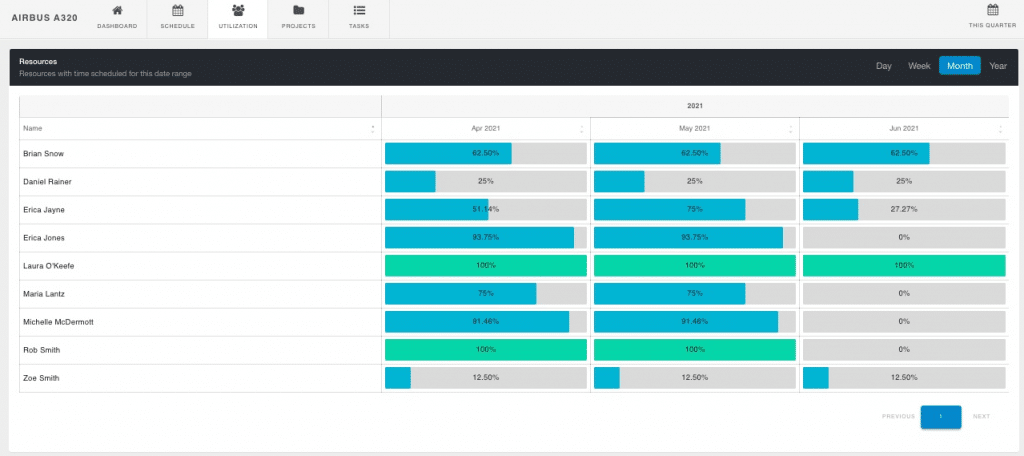
- Utilization shows resource scheduled time against the capacity as a percentage
- Scheduled Utilization rates for the resources booked on the project
- Highlights if resources are over scheduled (red), under scheduled (blue), at max capacity (green) or full availability (grey)
- Switch between 14 different date ranges to show utilization rates
- Display scheduled utilization rate split by Day, Week, Month or Year
- Shows Unassigned Work categories assigned to the Projects, Resources and Groups
- Scroll feature to view more utilization data
Projects
DISPLAY SCHEDULED TIME OF PROJECTS
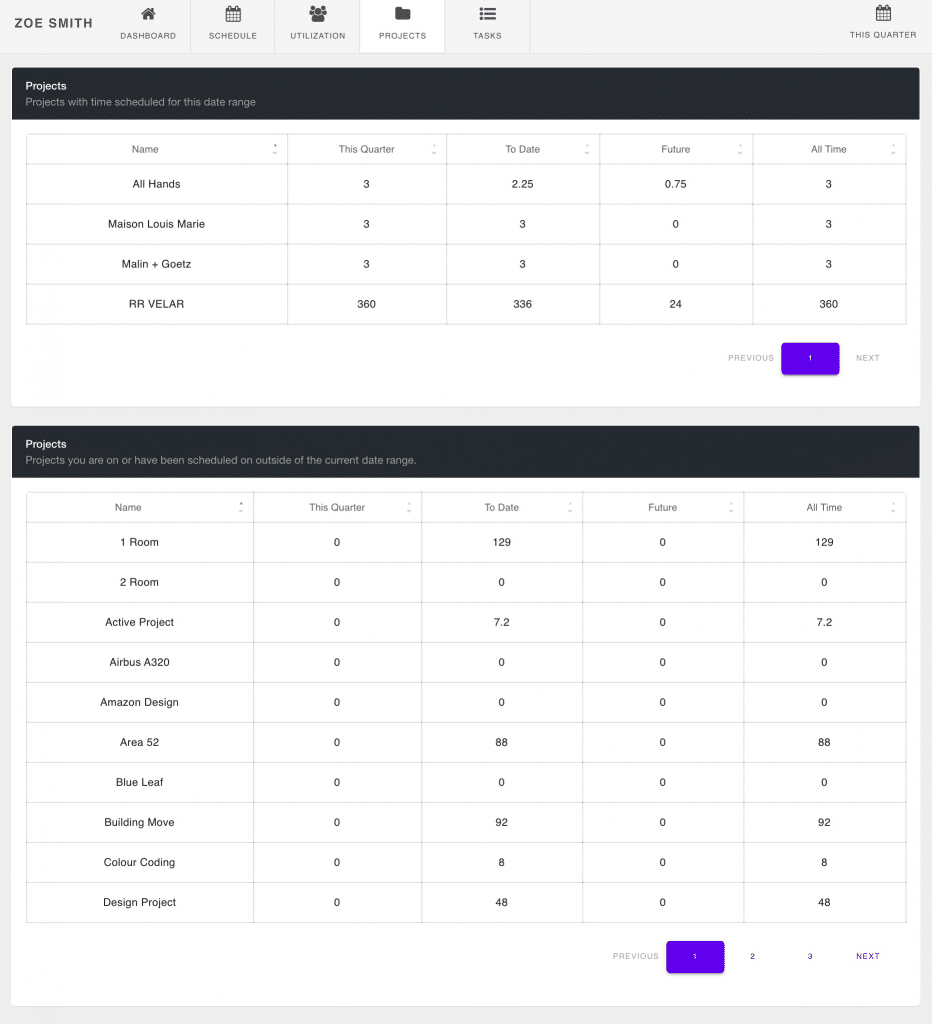
The Projects inline tab shows scheduled time on projects. View Project Scheduled Time for yourself, resources, projects and of course groups too. Pick from 14 date range options to display your project scheduled time. The My Projects dashboard has two widgets. The top widget shows projects with scheduled time for the date range chosen. The bottom widget shows projects you are on or have been scheduled on outside of the date range chosen.
The Projects tab shows Scheduled Time in 4 different format columns
- Date Range
- To Date
- Future
- All Time
Tasks
DRAG & DROP TASKS
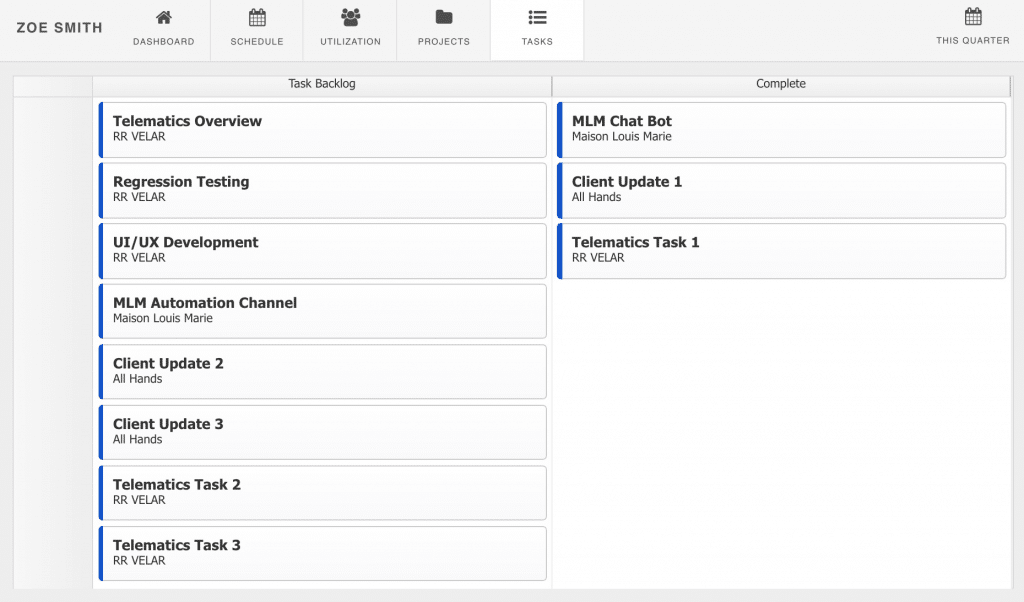
- View all the tasks either you have been assigned, by project or resource and groups.
- 2 swim lane columns showing Task Backlog and Completed Tasks
- Easily update tasks by using the Drag & Drop function
- Quickly remove tasks

Sidebar – Home | Project | Resource
USE THE SIDEBAR TO NAIVGATE THROUGH DIFFERENT DASHBOARDS
Use the Sidebar to scroll and select different Dashboard options by Project, Resource or Group.
- My Dashboard – Showing your Project and Resource Time and Spend data
- My Projects & Events – The Dashboard is filtered automatically by your time only
- Groups Dashboards – View Dashboard data of Project or Resource Groups as a whole
- My Managed Projects – Project Managers have sight of Dashboards for the projects they manage
- Project and Resource Groups – Scroll to select single Projects or Resource Dashboards from Groups
My Dashboard
QUICK ACCESS OVERVIEW OF KEY USER DATA
My Dashboard is packed, full of useful widgets and graphs to help the entire team get a glimpse of key data and how they are scheduled within Hub Planner. Smart inline tabs show the schedule timeline, utilization split options, project scheduled time and manage tasks.
- Great Overview of Your Week
- Analytics – Graphs & Charts
- Quickly See your Utilization & Availability
- Reported Time vs Scheduled Time
- Inline Tabs to view your a Timeline of your Schedule
- Split options of your scheduled Utilization
- View scheduled time of your Projects
- View, Manage, Drag & Drop Tasks
- Choose between 14 Date Range Options

Installing the Dashboard Pro Extension
The Dashboard Pro extension needs to be installed before it can be used. Once the extension is installed your Dashboard page will be available from the header and settings menu. There is no special configuration needed, you can dive right in and the dashboard will be available for all of your team of users.
To install the Dashboard Pro Extension, login to your account. Navigate to settings and choose the manage extensions page. Find the extension from the list and follow the installation steps to trial or buy the extension. If you do not have rights you should have the option to request this extension to be installed by an Admin with permission rights. Click the Knowledge Base for more help in install a Hub Planner Premium Extension.
License
The extension license is based on a fixed cost per month or year.
Cost
Please login to your account. Navigate to Settings followed by the Dashboard Pro Extension to get a cost quote in your local currency. For Premium Licence holders, this extension is free of charge as part of your subscription package.
Reference File
For more assistance, please view the Knowledge Base for more information about the Dashboard Pro Extension
Blog Post
Have a read of the press release to coincide with the release of the new Dashboard and Dashboard Pro Extension Brand New Dashboard for Hub Planner

