Work Smarter with Conditional Formatting Reports
Conditional Formatting allows you to highlight, format, emphasize, flag and differentiate report data. Filter through data from a visual aspect.
In line with Hub Planners latest release of Project and Resource Reporting, conditional formatting option from the reporting toolbar is now live. Originating from software like Excel, conditional formatting is a way of highlighting data based on a rule(s) you have created. Real-time report analytics can now be formatted to visually emphasize data you created. Resource management scheduling and planning has never been easier with conditional formatting. Differentiating data can act like a flag. Which can allow for resource planners to manage scheduling and planning more efficiently.
Filter through data from a visual aspect.
Use Conditional Formatting for Capacity Planning and Project Forecasting
Part and parcel of resource management is the process of ensuring resources are best utilized and capacity quotas are met. Toggling back and forth through your report dates and data will allow you to visualize your analytics. By using conditional formatting, data trends are clear to identify how resources were utilized. You have a birds eye view with clear indicators of where requires your attention.
What worked well, what were the pitfalls. See what areas require focus and attention.
Opt to break the schedule to a daily planner or a go as vast as quarterly. Applying conditional formatting makes it so much easier to navigate through report data. This helps to envisage and preempt resource schedules ensuring maximum capacity and resource utilization.
Why use Conditional Formatting in Resource Management?
As mentioned. Conditional formatting is real-time analytics that helps to flag, highlight or emphasize important relevant report data that needs attention. So, instead of traipsing through report data analytics. Hub Planner does it for you. In turn, work smarter and manage resources better.
Report data is live, so you really can improve visibility for resource and project progress. By applying conditional formatting, it helps users focus on important aspects. Information that relates to project progress, budgets, resource overbooking and capacity planning etc.
How Conditional Formatting works in Hub Planner new Project and Resource Reporting?
Hub Planner’s new Project and Resource Reporting release have in excess of 60 pre-determined templates and counting. It also encompasses a report builder to allow you to create customized reports. The report toolbar provides the basis to edit, share, save and format the results from the report. Utilize the conditional formatting options to format the report to flag or emphasize results based on criteria entered.
Opt to highlight data by choosing characters to turn Bold, Italics or Strikethrough. Add a little color to help to visually emphasize the data.
Once conditional formatting rules are set and applied. The appearance of the report results are automatically updated with your chosen formatted options. The idea being, to flag or highlight important key information. Not only that, all conditional formatting data is in real-time. This is imperative for planning and forecasting projects and resource schedules.
Apply a rule which will alter the appearance of result data to highlight information as a result of the rule.
Conditional Formatting Example:
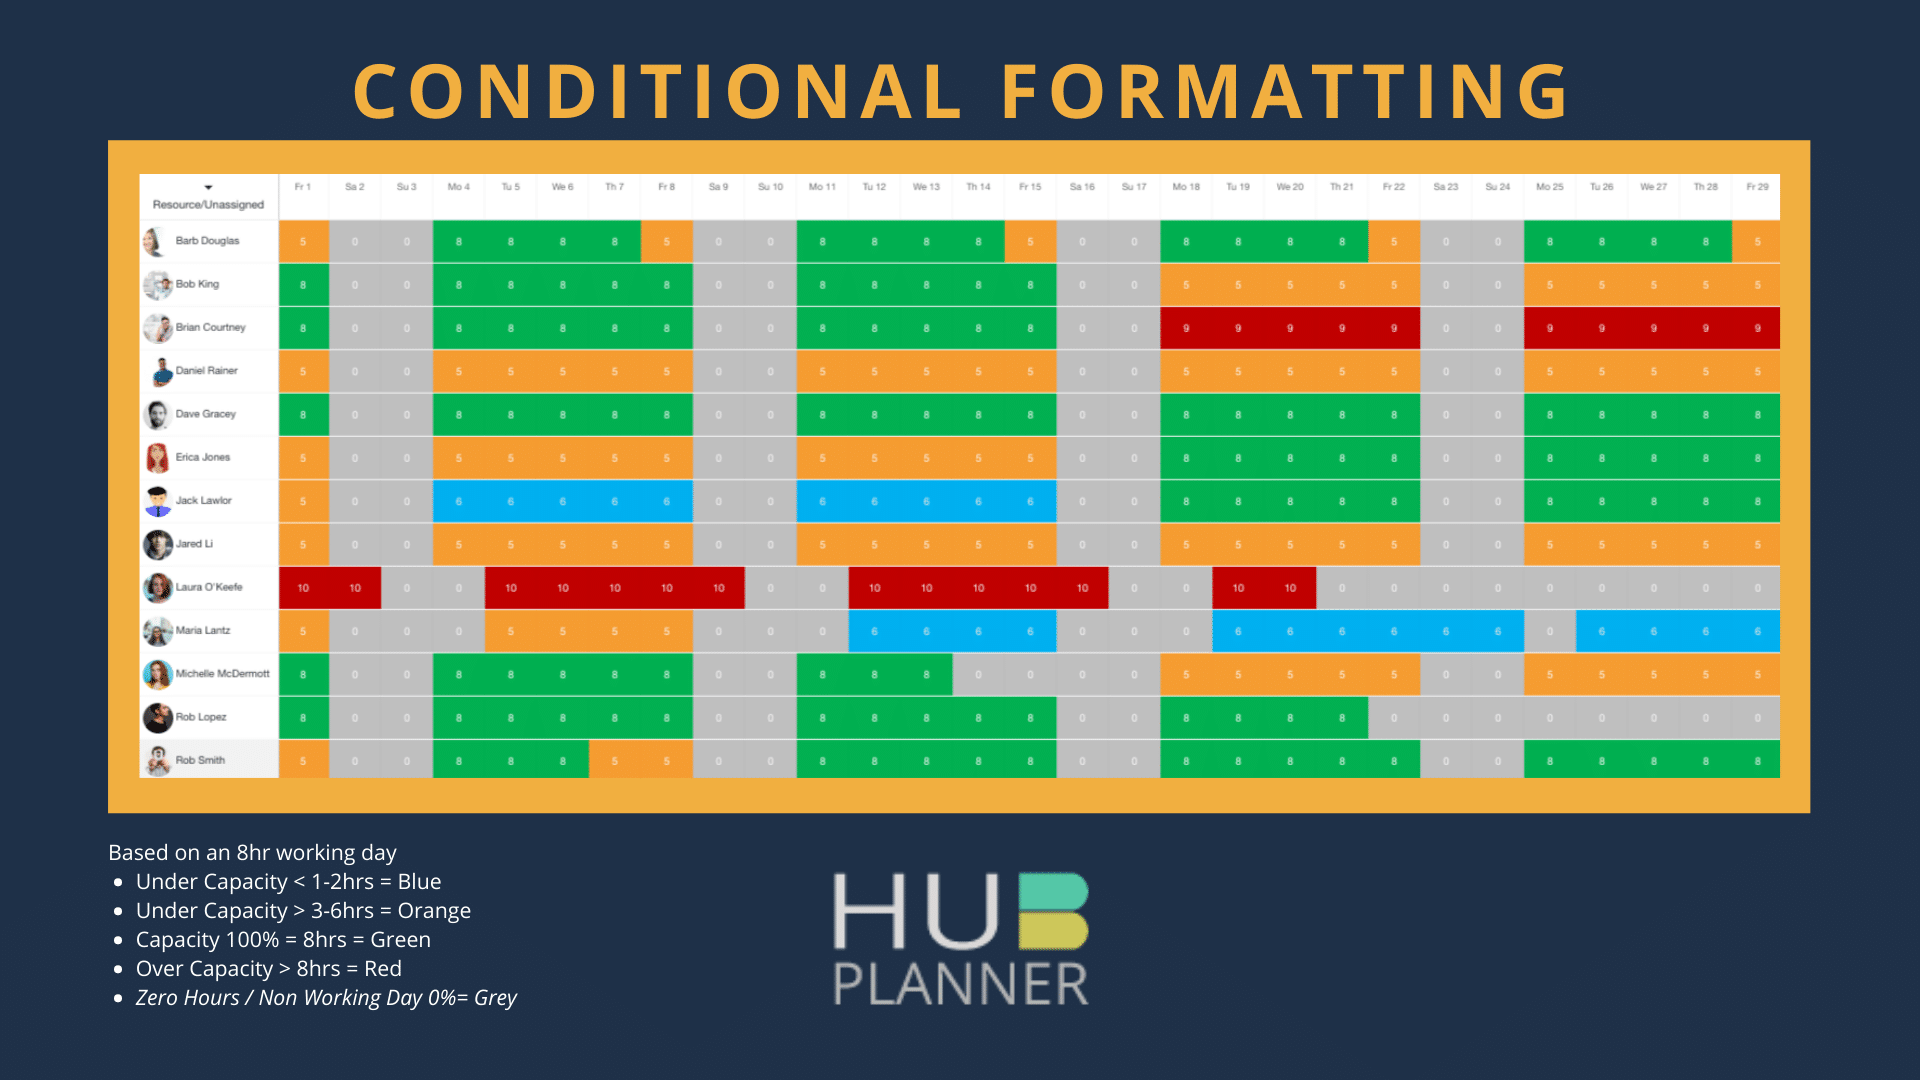
So, how does it work? Well, let’s look at one of the new templates and show you how to apply a conditional formatting rule. We’ll take one of the heat map templates as an example. The data will be scheduled time for this month. By applying a conditional formatting rule, we will look to highlight data in order to differentiate it. We want to clearly identify any resource under and overcapacity. The data is broken out per resource and their capacity quota of 8 hours per day.
Apply conditional formatting rules as follows:
- Any resource under capacity by 1 or 2 hours, change the color of their hours to ‘blue’.
- Resources under capacity by 3 – 6 hours, change the color to ‘orange’.
- Resources at 100% utilization of 8hrs, change the color of their hours to ‘green’.
- Any resources over capacity greater than 8hrs change to the color ‘red’.
- Any time at zero or nonworking day, change to the color grey.
By applying the above conditional formatting rules, we are able to visually identify resources capacity. Capacity data is clearly identifiable of resources who are under utilized on two different levels, over utilized and those that are at capacity. The idea being that we want to see as much green color as possible. The report naturally filters through resource hours and flags data that needs attention. I.e. the resource hours in blue and red. It naturally had you attention. Now, correspond to the scheduler and utilize the drag and drop feature to manoeuvre bookings to optimize resource capacity.
Structural Logic Format
Set one or multiple real time conditional formatting rules for your report.
From the resource and project reporting toolbar, click ‘Format’. A pop up to apply Heat Map Conditional Formatting rules will open. There are just a few short steps to create each condition to format your report.
Column Type
Choose the column from the drop down list you wish to format. Depending on the report type will determine the conditional formatting you can apply to a column. Options include:
- Time
- Spend
- Percentage
- Text
Conditions
There are 6 Time, Spend and Percentage conditions you can apply to format your report:
- Equal
- Greater Than
- Greater Than or Equal
- Less Than
- Less Than or Equal
- Not Equal
There are 5 Text conditions you can apply to format your report:
- Starts With
- Ends With
- Contains
- Equal
- Not Equal
Value
Enter text or toggle a value figure to determine results.

Conditioning Toolbar
The next line allows you to select and choose what way you wish results to be displayed. Options include:
- Bold
- Italics
- Underline
- Strikethrough
- Text Font Color
- Background Color
A snapshot of how the results will be displayed is show in the next field.
You can add more than one conditional format to your report. Simply select + Add New Condition to apply the next formatting condition. Now, repeat the above steps. To delete a conditional format, simply X the required.
Lastly, click Apply for results to adjust and activate.
Conclusion
Conditional Formatting is a simple and easy way to keep updated with key information for resource management. Formatting reports creates a visual call to action to important data, which allows you to make decisions more quickly and effectively. It also reduces time spent manually analyzing results. In turn, this allows you to focus on productive important decisions.