What does multi-level reporting mean?
Multi-level reporting means that you can navigate through the report for further information on the report.
How many Report levels are there?
4. There used to be just 2 Report Levels. But now there are 4 Report levels that you can sift through.
What’s the difference in the Report Levels?
- Is what you are grouped by, a resource for example. This is the template that you selected. For example, Resource Scheduled Time.
- Click a resource then you see all the projects for that resource.
- A detailed view grouping the same results day by day.
- Raw Results in line item style per day.
Note, the 3rd and 4th levels view are analogical to the 2nd report level. The 3rd and 4th report levels also have a context row, it is possible to apply inline filters, conditional formatting, sort data, download in Excel, save as My Reports and so on
Can I get to Report Level 4 straight away?
Yes, you can. This is achieved by simply not grouping report results. Otherwise known as ‘Non-Grouped Results’.
What are Grouped Results?
Each template within Hub Planner Reports is grouped by a certain element or factor. For example, Resource Scheduled Time. This is scheduled time grouped by resources for the date range applied.
What are Non-Grouped Reports?
This means that you can eliminate the report level grouping and access the raw results of all levels. All templates are grouped by a certain factor. For example Resources, Projects, Booking Categories, etc. By eliminating the report levels and factors. You can now see line item raw results.
What will I see by applying Non-Grouped Results to my report?
You are removing any factors or groupings. Now you can see a day by day breakdown of who did what at one level. Not only that, you can add multiple columns to create a master report of results.
How to ‘Do Not Group Results’?
There are a couple of ways to access the raw results. From within a template and from the report builder.
How to ‘Do Not Group Results’ from a Template?
- From within the template, navigate to the Report Toolbar
- Click ‘Edit’
- Select ‘Grouping’
- Click the checkbox ‘Do not Group Results’.
- Finish with clicking ‘Update Report’.

How to ‘Do Not Group Results’ from the Report Builder?
- From within the Report Builder
- Select the last tab ‘Grouping’ (before or after you have selected your type/data/filters and columns)
- Click the checkbox ‘Do not Group Results’.
- Finish with clicking ‘Build Report’.
Do I have to ensure the ‘Non-Grouped’ option is ticked?
To see full line item data, yes.
Can I click Non-Grouped on any level to get a line item layout?
Indeed you can. You can make your report a Non-Grouped report at any of the 4 levels.
How do I go back to a report level?
You can either click on the breadcrumb in the report address. Alternatively, you can edit the URL and remove the level from the URL and hit enter.
![]()
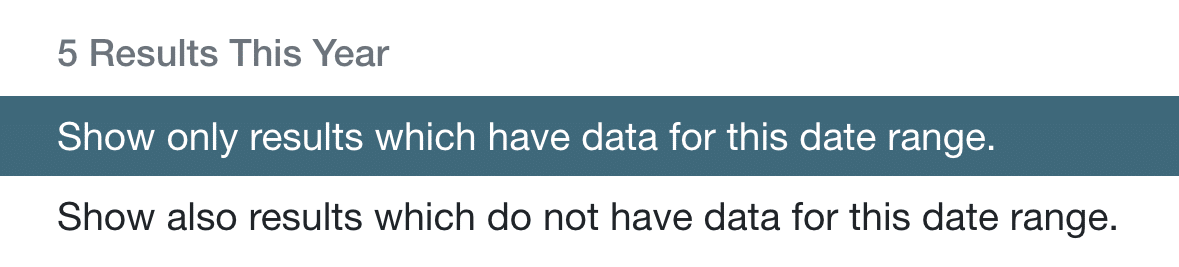
Can I exclude data with no results on each reporting level?
Yes. To do so:
- From the Report Toolbar
- Click the first icon ‘Results’
- Select ‘Exclude Data with no results for date range’
- Results will filter out any line items with no data.
Remember this is for the date range you have selected.
I only want to see dates with data?
Same as above. To do so:
- From the Report Toolbar
- Click the first icon ‘Results’
- Select ‘Exclude Data with no results for date range’
- Results will filter out any line items with no data.
Remember this is for the date range you have selected.
I only want to see projects/resources with data in my results?
Again, this is the same as above.
To do so:
- From the Report Toolbar
- Click the first icon ‘Results’
- Select ‘Exclude Data with no results for date range’
- Results will filter out any line items with no data.
Remember this is for the date range you have selected.
Why are there results with no data?
This means that whilst there are no results for the date range. But there may be results on subsequent dates.
Can I add columns to the next report levels?
Absolutely! This is exactly what we want you to do. Create really definitive reports by adding in multiple columns. Bear in mind, they need to make sense of the report. Otherwise, they will be greyed out.
To add columns to a report:
- Edit
- Columns
- From the left-hand side, scroll through and add in columns you wish to see
- Feel free to add a few more columns
- Remove any unwanted or greyed out columns
- Position the order of columns to your preference.
- Update Report
- If your column is not supported it will be greyed out.
Why do I only see dates and not the project/resource name?
You can add columns to this report that are functional to the report. So for example. Project Scheduled Time non-grouped results. I want to see the breakdown but also corresponding projects and resources the data belongs to.
- Edit
- Columns
- Add in Text Field ‘Project Event Name’
- Add in Text Field ‘Resource Name’
- Feel free to add some more columns
- Remove any unwanted or greyed out columns
- Position the order of columns to your preference.
- Update Report
- If your column is not supported it will be greyed out.
Why are there ‘greyed out’ columns?
This will mean that the column is not supported. In other words, it won’t make sense in this report. You can easily remove these columns by following these short steps:
- Click ‘Edit’ in the Report Toolbar.
- Select ‘Columns’
- Remove the columns
- Click Update Report
- The greyed out columns will now have disappeared.
Can I create a date column report from a non-grouped report?
Like a Heat Map? No. You should navigate to Heat Map reports for this.
Can I save the non-grouped report I made?
Absolutely. You have the following options all located within the report toolbar:
- Save as ‘My Saved Reports’ which is visible to just you.
- Save as ‘Internal Reports’ which as visible to all who have access to this report folder.
- Share the link to the report. Create a URL to the report.
- Download the report to Excel (XLS) format.
- You can also create a chart of the report too.
Can I add Conditional Formatting to the report?
Yes. Click ‘Format’ within the Report Toolbar. From here, create and apply as many formatting rules as you wish. Suggest you save the report for ease of access in the future.
What about applying Filters?
Yes, apply inline filters as you require. You can apply at any level of the report.