Project Reports
Generate reports by specific project. There are 4 project report categories you can generate from.
- Scheduled Time
- Reported Time
- Booking Categories
- and Project Burn.
While some may be self explanatory, let’s take you through each of them to ensure that you are optimizing the most out of Hub Planner’s reports.
Project Reports Templates
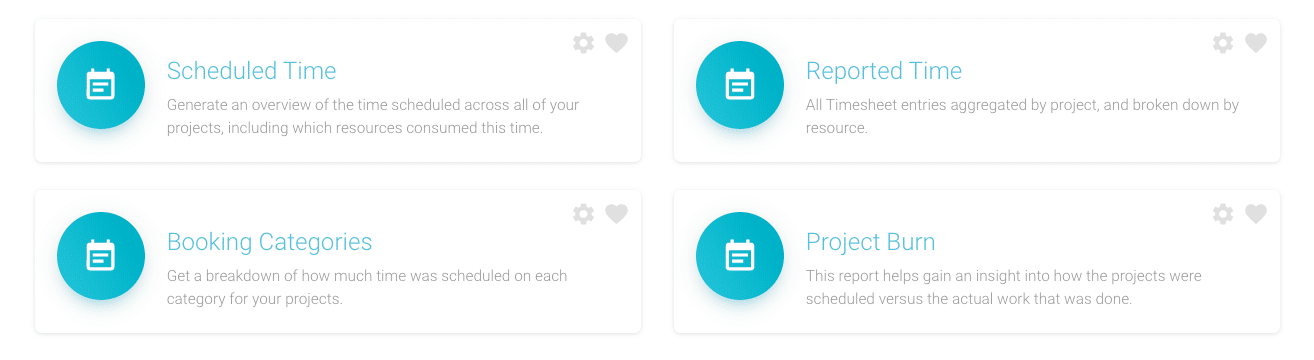
Scheduled Time
Ok, so the clue is in the title right. When you have the billing panel enabled within your scheduler. You have sight of real time information in terms of scheduled and actuals. This information comes in the form of hours and finance. We are going to look at the hours scheduled.
Your billing panel will show you all hours calculated that are due to be scheduled on the project in question. So, that would mean any hours planned and allocated to the project. Scheduled time will most likely represent time forecasted. However, it can also be time scheduled that has from the past that has not yet been reported.
How to find Project Scheduled Time using the Home Grid?
- Within the Reports Home Page click on the ‘Project Reports’ icon.
- Click the ‘Scheduled Time’ icon.
- The interface will now show a table displaying all ‘Active’ projects with any time scheduled.
- The table headers titles are: Project Name | This Month | To Date | Future | All Time which will display the total hours scheduled.
How to generate a Report of Reported Time using the Sidebar?
- Within the Reports home page, click ‘Project Reports’ on the left sidebar.
- Click ‘Scheduled Time’.
- The interface will now show a table displaying all ‘Active’ projects with any time scheduled.
- The table headers titles are: Project Name | This Month | To Date | Future | All Time which will display the total hours scheduled.
How to view Scheduled Time of selected project by Resource
- Continuing from the previous steps from the table displaying Active Projects, simply click on the Project Name you wish to activate.
- Now a list of resources with scheduled time on the selected project will display.
- The project has broken down the hours by resource under the same headings: Project Name | This Month | To Date | Future | All Time
- The interface will now show a table displaying all ‘Active’ resources with any time scheduled on the project.
Reported Time
Similar to Scheduled Time above however Reported Time has been submitted to Timesheets. When you have the billing panel enabled within your scheduler. You have sight of real time information in terms of scheduled and actuals. This information comes in the form of hours and finance. We are going to look at the hours scheduled.
Your billing panel will show you all hours calculated that are due to be reported on the project in question. So, that would mean any hours have spent on the project. And more importantly submitted to timesheets. To obtain accurate reports, it’s imperative that we utilize timesheets as frequently as possible.
How to find Project Reported Time using the Home Grid?
- Within the Reports Home Page click on the ‘Project Reports’ icon.
- Click the ‘Reported Time’ icon.
- The interface will now show a table displaying all ‘Active’ projects with any time reported.
- The table headers titles are: Project Name | This Month | To Date | Future | All Time which will display the total hours reported.
How to generate a Report of Reported Time using the Sidebar?
- Within the Reports home page, click ‘Project Reports’ on the left sidebar.
- Click ‘Reported Time’.
- The interface will now show a table displaying all ‘Active’ projects with any time reported.
- The table headers titles are: Project Name | This Month | To Date | Future | All Time which will display the total hours reported.
How to view Reported Time of selected project by Resource
- Continuing from the previous steps from the table displaying Active Projects, simply click on the Project Name you wish to activate.
- Now a list of resources with reported time on the selected project will display.
- The project has broken down the hours by resource under the same headings: Project Name | This Month | To Date | Future | All Time
- The interface will now show a table displaying all ‘Active’ resources with any time reported on the project.
Booking Categories
Produce a report of how much time is being spent by Booking Category. If you haven’t set them up yet, have a look at the best way to color code booking categories before you do. From here you can actively see where time has been spent or scheduled by booking category. For example, you might see that the design stage of the process is taking up a lot of resource time. You might need to allocate another resource here. These reports allow you to asses and forecast demands along the process allowing for strategic implementations.
Using the Home Grid?
- Within the Reports Home Page click on the ‘Project Reports’ icon.
- Click the ‘Booking Categories’ folder.
- The interface will now show a table displaying all ‘Booking Categories’ projects with any time scheduled.
- The table headers titles are: Booking Category | This Month | To Date | Future | All Time which will display the total hours reported.
How to generate a Report of Booking Categories using the Sidebar?
- Within the Reports home page, click ‘Project Reports’ on the left sidebar.
- Click ‘Booking Categories’.
- The interface will now show a table displaying all ‘Booking Categories’ projects with any time scheduled.
- The table headers titles are: Booking Categories| This Month | To Date | Future | All Time which will display the total hours reported.
Project Burn
This report is very handy for assessing the progress of your project against the time you had originally allocated. So, for example you could see that in the last month we have progressed through 20% of the total time. Where you had scheduled in to really only consume 15%. Are we still on track? Or are we behind on a stage that is taking up too much time? On the other hand it could be the opposite that you have progressed less than you expected. Either way, it’s a great template to assess your project burn rate.
How is Project Burn Calculated?
Reported / Scheduled = Burn Rate. This could be calculated in Projects and Resources.
Project Burn Rate. For example, a project has 400hrs scheduled and 200hrs reported. Therefore, 200hrs reported / 400hrs scheduled = 50% Burn Rate.
Resource Burn Rate: For example, a resource is scheduled for 40hours and has reported 20hrs. Therefore, 20hrs reported time / 40hrs scheduled time = 50% Burn Rate.
How to find Project Burn using the Home Grid?
- Within the Reports Home Page click on the ‘Project Reports’ icon.
- Click the ‘Project Burn’ folder.
- The interface will now show a table displaying all projects with ‘Project Burn’ percentages.
- The table headers titles are: Project Name | This Month | To Date | Future | All Time which will display the project burn progress percentages.
How to generate a Report of Booking Categories using the Sidebar?
- Within the Reports home page, click ‘Project Reports’ on the left sidebar.
- Click ‘Project Burn’.
- The interface will now show a table displaying all projects with ‘Project Burn’ percentages.
- The table headers titles are: Project Name | This Month | To Date | Future | All Time which will display the project burn progress percentages.
How to change the date range for the reports?

- Within the Reports home page, click ‘Project Reports’ on the left sidebar.
- Click report you wish to activate, for example ‘Scheduled Time’ or alternative template.
- The interface will now show a table displaying all ‘Active’ projects with any time scheduled.
- Navigate to the top right hand side of the interface where you will see the default dates entitled ‘This Month:’.
- Simply click on the date to allow the pop up to appear.
- Select your desired range of dates from the drop down list of options.
- Alternatively create your own custom date range by entering in the date data by calendar.
- Lastly, click ‘Apply’.
- Any Projects with scheduled time within your created date range will now show
How to Use the Inline Filter
- At any stage of the table, you can create a filter under any of the columns to amend what is displayed.
- Options include
- Equal
- Greater Than
- Greater Than or Equal
- Less Than
- Less Than or Equal
- Not Equal
- To alter, simply click on the ‘upside down triangle’ on the top right of each column. The pop up list of options will appear.
- Select your desired option and enter the value.
- Click ‘Filter’ to apply or ‘Clear’ to revert back.
- The interface will now show a table displaying all ‘Active’ Projects / Resources with any time scheduled in accordance to your filter.
Can I sort in ascending / descending order?
- To change the sorting of the results simply click on the column header you with to sort by.
- Click again to change back.
- A black triangle will appear to show which column you are sorting by.
How to change what is displayed within each column?
There are two ways in which you can access to change.
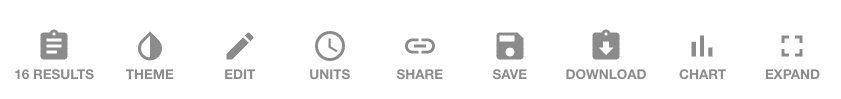
- From the sidebar, while hovering upon any of the options – you will notice a cog (settings) icon. Click on this to access the pop up filter settings.
- From the table within a report. Click on ‘Edit’ from the toolbar of options located at the top of the table.
- Then select ‘Columns’.
- There are 100+ column options for you to choose from.
- Simply click your desired column options.
- You can drag and drop columns in order of preference.
- You can also alter the date range at the top of the pop up.
- Filters and Grouping are also options to access here.
- To activate, simply click ‘Generate’ at the bottom left hand corner of the screen.
How to filter results?
There are two ways in which you can access to change.
- From the sidebar, while hovering upon any of the options – you will notice a cog (settings) icon. Click on this to access the pop up filter settings.
- From the table within a report. Click on ‘Edit’ from the toolbar of options located at the top of the table.
- Then select ‘Filters’.
- Depending if you are in a Project, Resource or Budget report will depend on what Filter options are available to you.
- There are copious options for you to choose from.
- Simply click your desired filter options from the left hand column.
- From there, you will be asked to select the options you wish to sub filter in the report
- You can drag and drop columns in order of preference.
- You can also alter the date range at the top of the pop up.
- Filters and Grouping are also options to access here.
- To activate, simply click ‘Update Report’ at the bottom left hand corner of the screen.
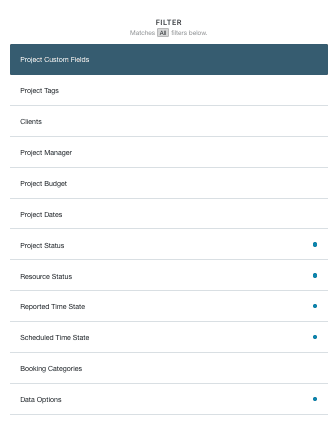
Filter Options
Further Reading
- Reports Feature Page
- Reports Press Release Blog Post