New Cross Filters now Available in Reports.
Use filters for deep dive into report analytics in resource management. Maximise the information to better decision making in scheduling resources and project planning.
Hub Planner have installed in excess of 70 pre-formatted templates which allow for a high level breakdown of data. The Hub Planner Report Builder allows you to apply as many or as little filters as we need. Filters allow us to delve into the nitty gritty of project and resource data. What was predetermined by the initial report type. You now have the opportunity to cross filter. So what this means is whether you can now filter reports regardless of report type.
Some filter options have two columns meaning what you select in the left hand column will create more options on the right hand side for you to choose from.
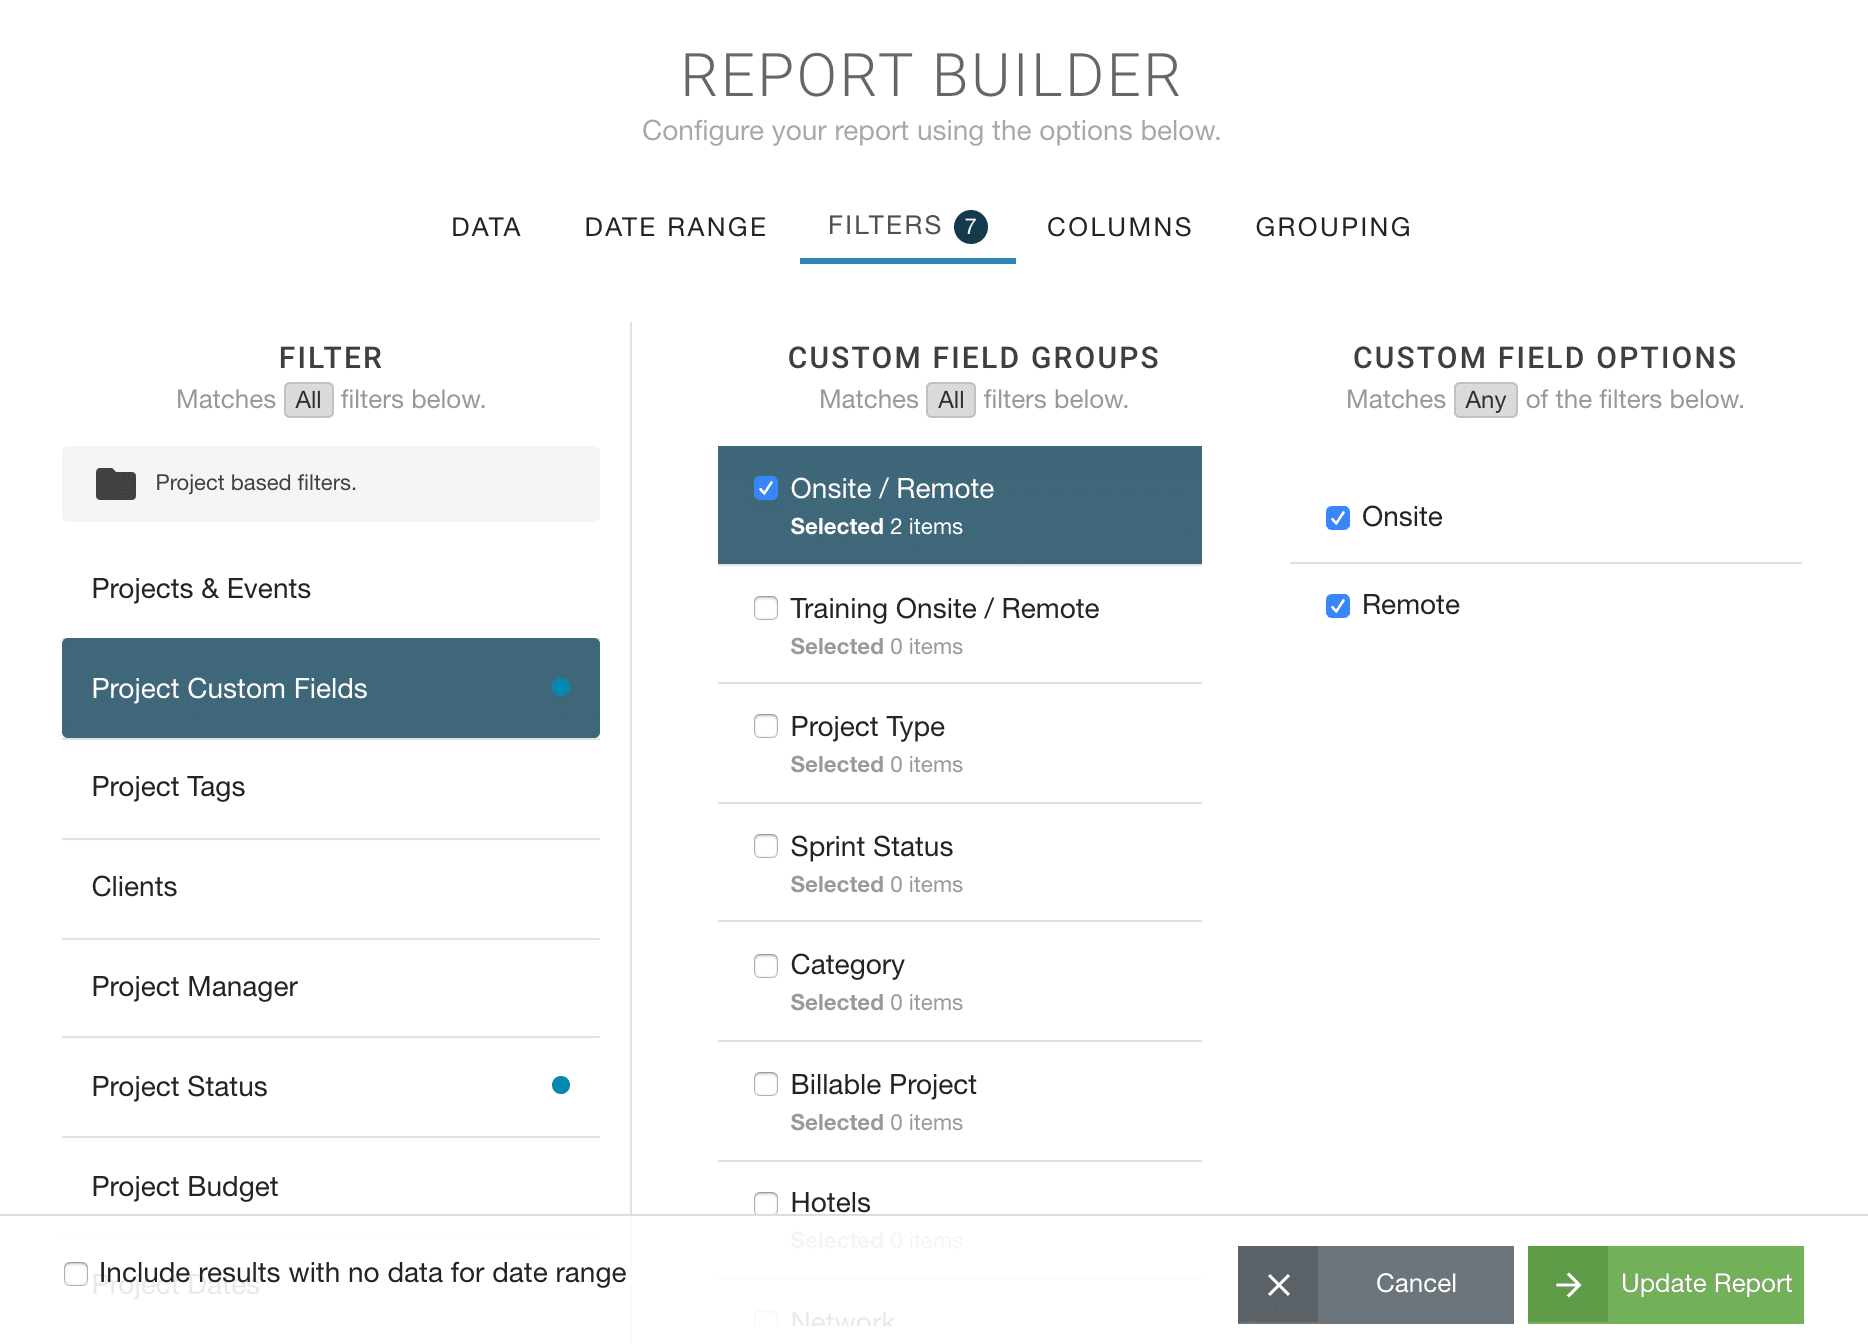
What can I filter by?
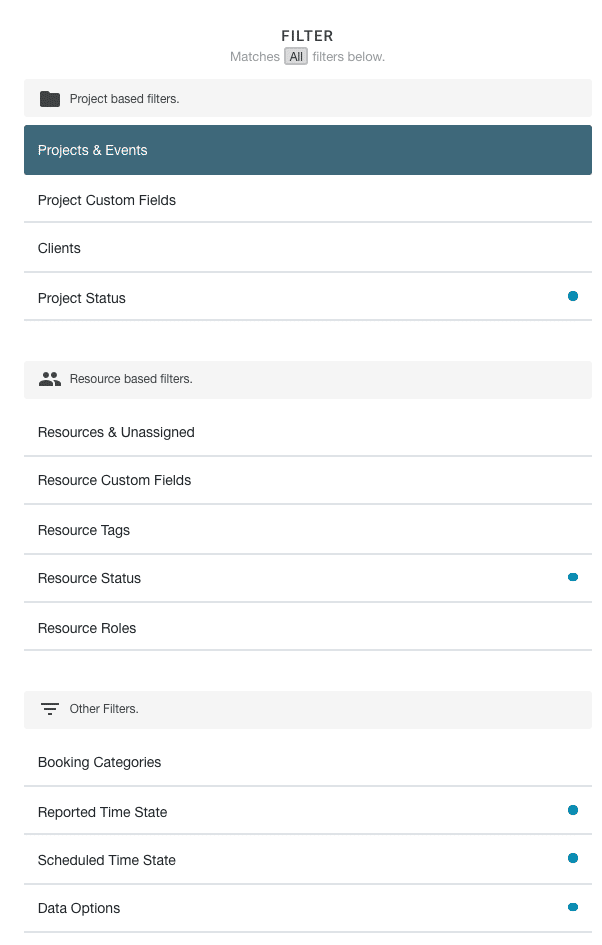
There are three categories of filters: Projects, Resources and Other Filters.
 Depending on the type of report chosen, you can filter by the following:
- Projects/Events/Resources
- Project/Resource Custom Fields
- Project/Resource Tags
- Clients
- Project/Resource Status
- Project Budget
- Resource Roles
- Project Dates
- Project Manager
- Booking Categories
- Time Handling (Scheduled & Reported)
- Data options
What can we tell from using Report Filters?
There are so many questions that can be answered by applying filters. From resource capacity, to finding out how much time you are spending on clients. Here are some examples:
What projects are you making most from in the EMEA region?
What booking category is taking the longest?
Filters can help with a multitude of decision making in Resource Management. Even to the simple things like forecasting when are we really busy?
Do we need to hire more contractors?
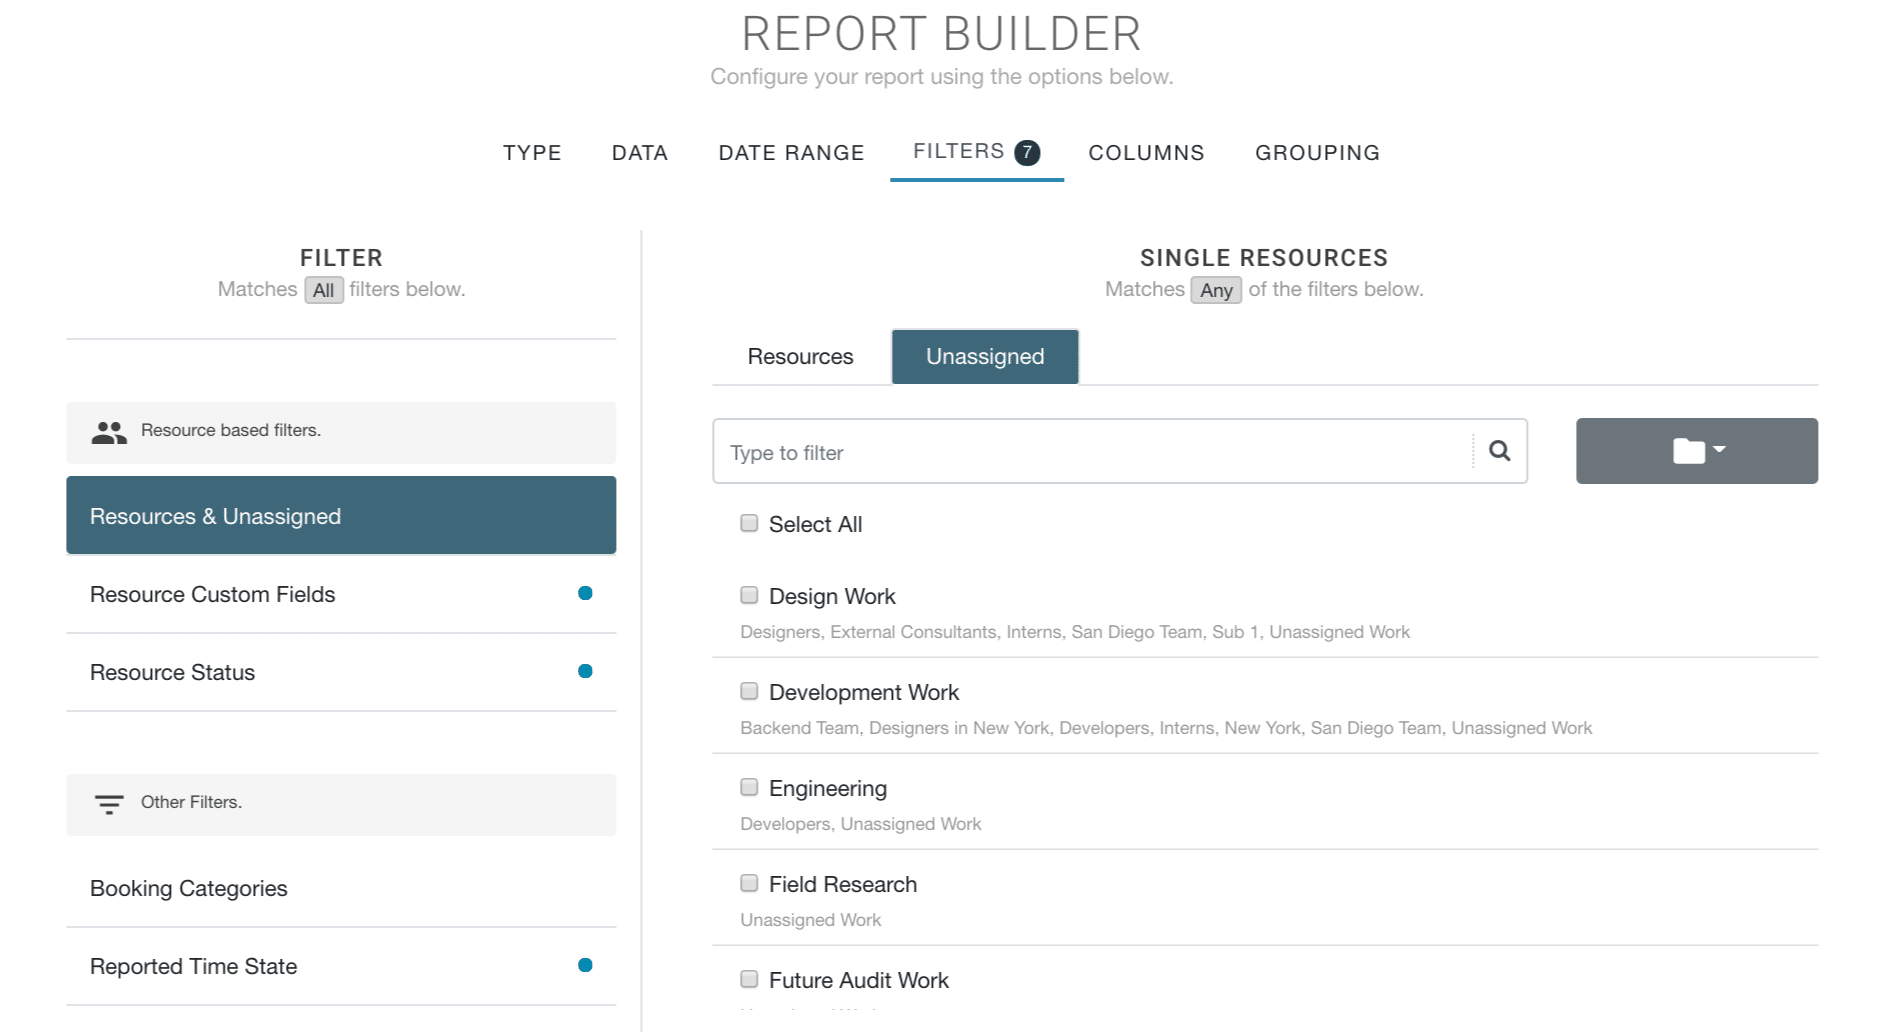
Filter Tabs
For most filter types on the left hand side provides you with corresponding options that you can select and deselect on the right hand side. There are a couple of filter types that require more specific data requirements. For example, Choosing Project Budget as a filter type. You have some clever options that allow you to create a more specified report. Select the Budget Status from the drop down menu, followed by the Budget Range and then lastly you can enter the value amount. Now you have a configured detailed report defining when say you have a list of projects that were over budget by more than $10,000 and less than $20,000. You can get a sense of how valuable these reports can be to making informed decisions.
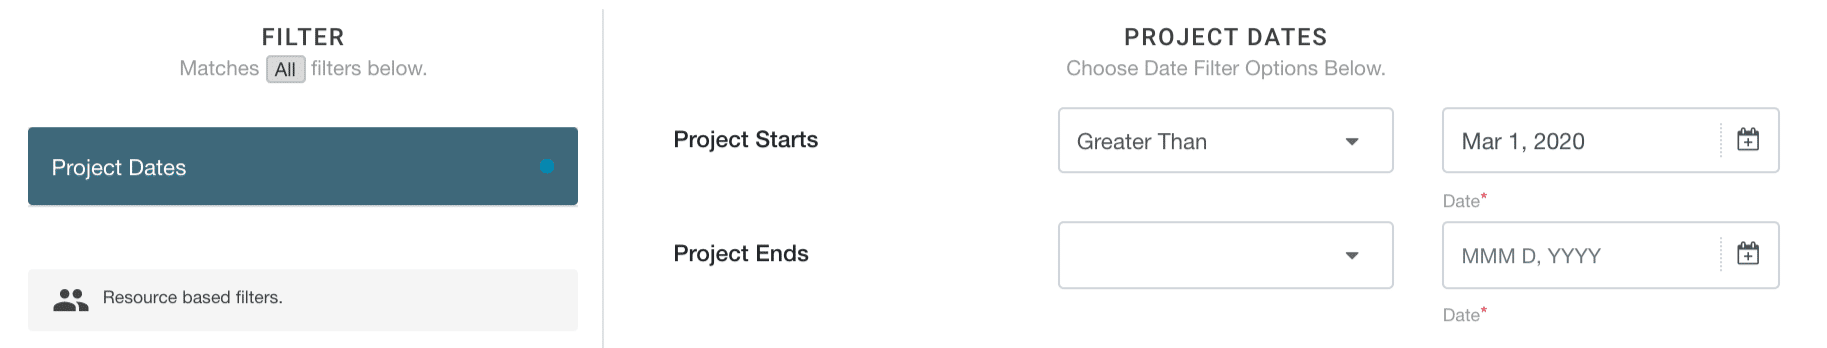
Another example being Project Dates. You can select to view data between specific dates. Again, great for reporting to the finer details of how projects are performing.
Filter Tabs
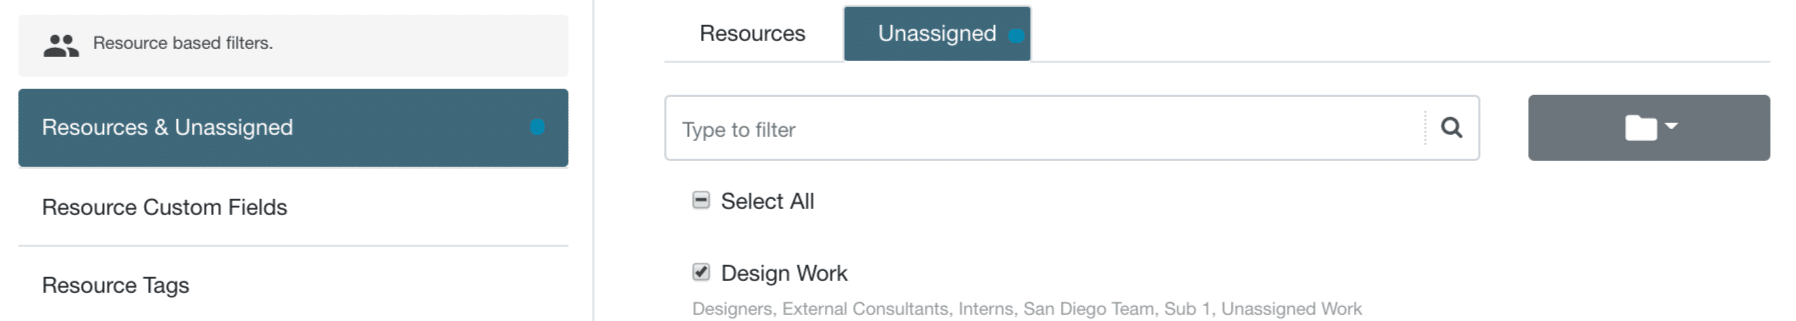
For the likes of Resource/Unassigned or Project/Event you will notice that each has their own filter tab. Tabs allows you to filter through the finer details. Note, should the Unassigned Work extension not be installed. This will not be visible to you.
What is Cross Filtering?
Cross filtering goes that one step further and allows you to filter regardless of report type. For example, Project Scheduled Time filtered by Resource Custom Fields. Filters do not need to be the same report type. I am not restricted to filtering for like with like. Project reports to Project filters, Resource reports to resource filters, etc.
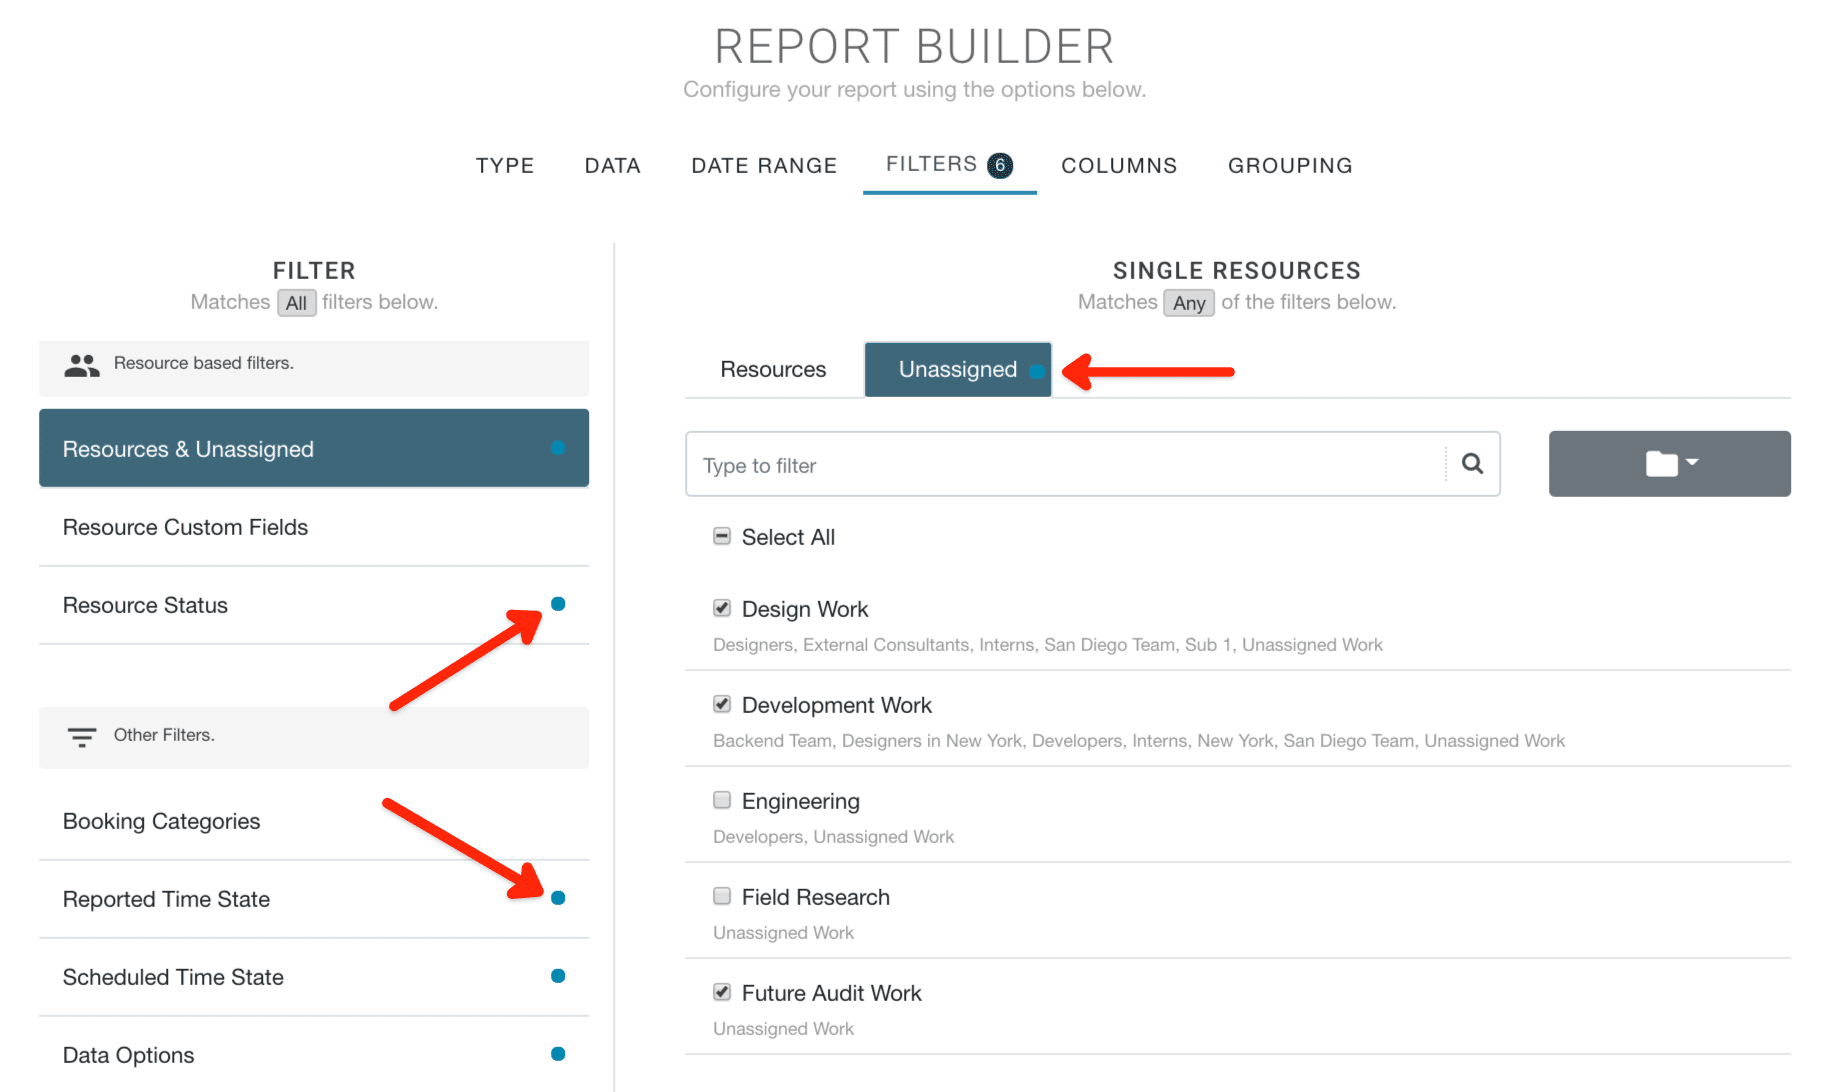
How do I know if a Filter is activated?
Active filters are represented by a blue circular dot. See below image from the Filter tab of the Report Builder.
Clever Prediction
What I really like is that while there are many filter options within the Report Builder. The report type and data you select will automatically navigate you to what Hub Planner predicts your next step. Clever right? Say you choose Unassigned and then Non Billable work. When you select Filters, you will be automatically navigated to Booking Categories as a default which would be the natural flow in the process.
What else has been happening with new reports?
There have been lots of updates with the release of the new Hub Planner Reports. You should really check out the blog articles and really helpful Knowledge Base. Let’s take a brief look into what’s updated.
Firstly, you have the ability to drill down through reports for a breakdown of raw report results. What was previously two levels of report results, now accelerate analytics with navigating through up to four levels of report results. Simultaneously, now stay within the same report to view multiple levels of report results.
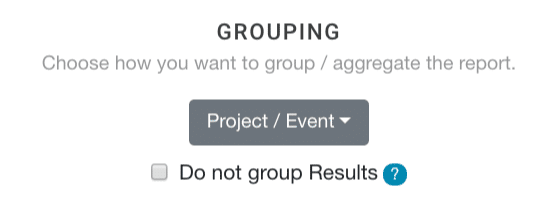 Another new and accompanying update to the recently released Hub Planner Reports is a really useful feature to non-group report results. What does this mean? This means that the user can remove any levels for a thorough breakdown of raw results data reporting. From here, it’s easy to add in data columns to showing a line item report results. Read more -> Non Grouped Rows & Multi Level Reporting
Lastly, we have added 81 new data columns. See key information from real time analytics for efficient resource management and project planning. With the addition of the new columns to reports. Users can now add in more data options that would have been previously not available or restricted to the report type. Now, Reports are more clear. More fluid and easier to access. Read more -> New Report Columns