How to Calculate Resource Utilization?
Measuring resource utilization is a core ingredient to any solid resource management flow. As a result utilization tends to be a highly sought after metric by the management team or leadership groups. While management are interested in seeing the bigger picture, production teams are also keen to understand how they are progressing. In order to calculate resource utilization you need to first understand what it is, and how you want to calculate it. There are a couple of ways you can look at resource utilization. In this example we will first look at the 2 main calculations when it comes to resource utilization, and then the factors that can influence that.
- Scheduled or Forecasted Utilization
- Actual or Reported Utilization
The difference between both of these utilization’s is that one looks at forecasted time (via scheduler) while the other looks and reported time (via timesheets). Both calculations produce an interesting metric and allow the modern digital project manager to compare both metrics side by side, in order to gain valuable insight into how the team is performing.
The Resource Utilization Calculation Formulas
Two formulas for calculating the resource utilization are highlighted below.
How to Determine Resource Capacity?
Determining your resources capacity differs from company to company, and it depends what type of results you are expecting. Using 7 or 8 hours is standard in the majority of companies. You have other considerations to take into account based on your business, and the type of work your resources take on. Whether you want to count a resources capacity purely on production work, or any capacity they have to take on work, even if internal work or time off. The latter is more popular as essentially you schedule everything on a resource, including work that is not production related like Vacation, meetings or personal time off.
A resources capacity is key if you are using scheduled or actual utilization, and indicates the working capacity of a resource over a period of time.
Scheduled Time
This is the time you have allocated for the resource to work on tasks or consume their capacity. It can be a percentage of the resources capacity, or specific number of hours, but it always resolves to a time in the calculation. The percentage of a resources capacity can be a better way to schedule, as it always fills the resources to a percentage of their capacity capacity, which is useful if they work different hours per day and not a strict 9-5. e.g. Friday I work 9am – 2pm, so on Friday a 100% of my time would be 4 hours taking into consideration a 1 hour lunch break.
Reported Time
Time that a resource has submitted via their timesheets is considered Reported Time. The resource does not necessarily have to be scheduled on the project, but it indicates the time they have put towards any project or event. Doing timesheets essentially creates the actual time metric which allows you to create actual utilization.
Scheduled and Forecasted Utilization
For project managers who do not ask their team to take part in timesheets, then scheduled utilization is one of the most popular methods to calculate resource utilization for the team based on their scheduled production hours. The calculation used is as follows:
Actual and Reported Utilization
Teams using timesheets to record the time they have spent on a project is becoming more industry standard these days. Analyzing the metrics afterwards is even more standard practice. Calculating actual utilization is a method in which you will measure the reported time against the resources capacity, and create a percentage from that.
Explaining The Difference between Scheduled versus Actual Utilization.
There is a difference between Scheduled Utilization and Actual Utilization in this example. From the examples it is clear to see that the timesheets have less hours than what was forecasted and that explains the difference. In the real world this difference could have many explanations such as timesheets being incomplete, or the resource completing the work in less time than forecasted to complete the work in.
What about Vacation Time, PTO, Annual Leave?
Events such as vacation, annual leave, meetings, out of office are taken into consideration when it comes to the scheduled time. In fact just because it is something non project related does not mean it should not be accounted for in the scheduler. So this way your utilization keeps it’s integrity but always having a resource booked according the project plan or resource management practices.
Exclude time worked on certain projects towards utilization?
This is always going to come up and there is a solution. You can edit on any project or event, time that you do not want recored towards a resources availability. This is covered well by Hub Planner using this advanced settings on projects or events, read more here. This helps if a resource is taking on extra work or work as part of their role that you don’t want to count towards their capacity to take on billable or project based work. A good example could be a senior designer is doing some planning work for internal meetings, wants this in their schedule to be transparent but does not want it to affect their schedule.
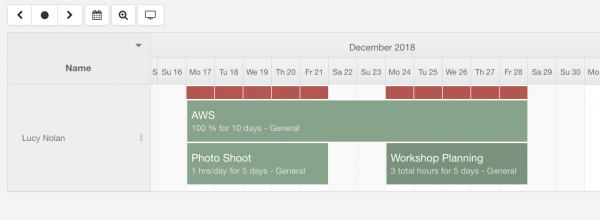
shows a resource being over utilized due to 2 internal events for 1hr/ day the first week and a total of 3 hours for the 2nd week.
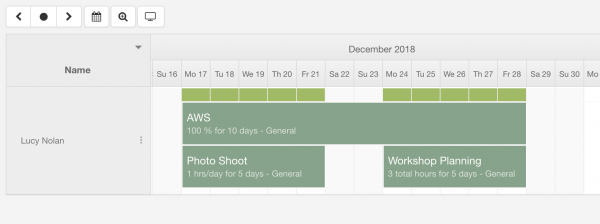
The 2 additional bookings for Photo Shoot and Workshop planning have been adjusted to not count towards the resources availability and utilization.
Should I use Scheduled or Actual Utilization?
You should use whatever metrics help you and your team run more effectively and smoothly. If you are using timesheets then it is a perfect scenario to use both metrics and compare them. You can find interesting bits of information about how resources are using their time and unlock some key metrics to help understand your team better. If you don’t use timesheets in your business then not to worry, the scheduled utilization is a very popular way of reporting on how the team are forecasted to perform using a tool like Hub Planner’s Scheduler. Either way you should be looking at utilization for your team and making sure you are calculating utilization correctly.
How can I visualize resource utilization?
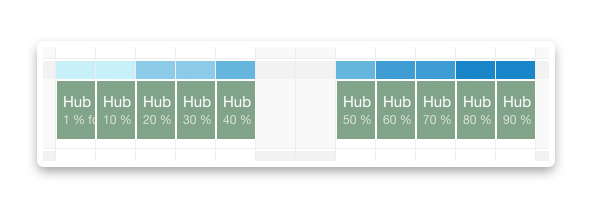
Hub Planner is a modern resource management software designed specifically for visualizing resource utilization. The resource scheduler offers a heat map style layout to help color code your utilization values from 0% – 200% all at different color intervals. If you feel its time to move away from spreadsheets to a real resource management solution, you get 2 months for free using our 60 day free trial.


