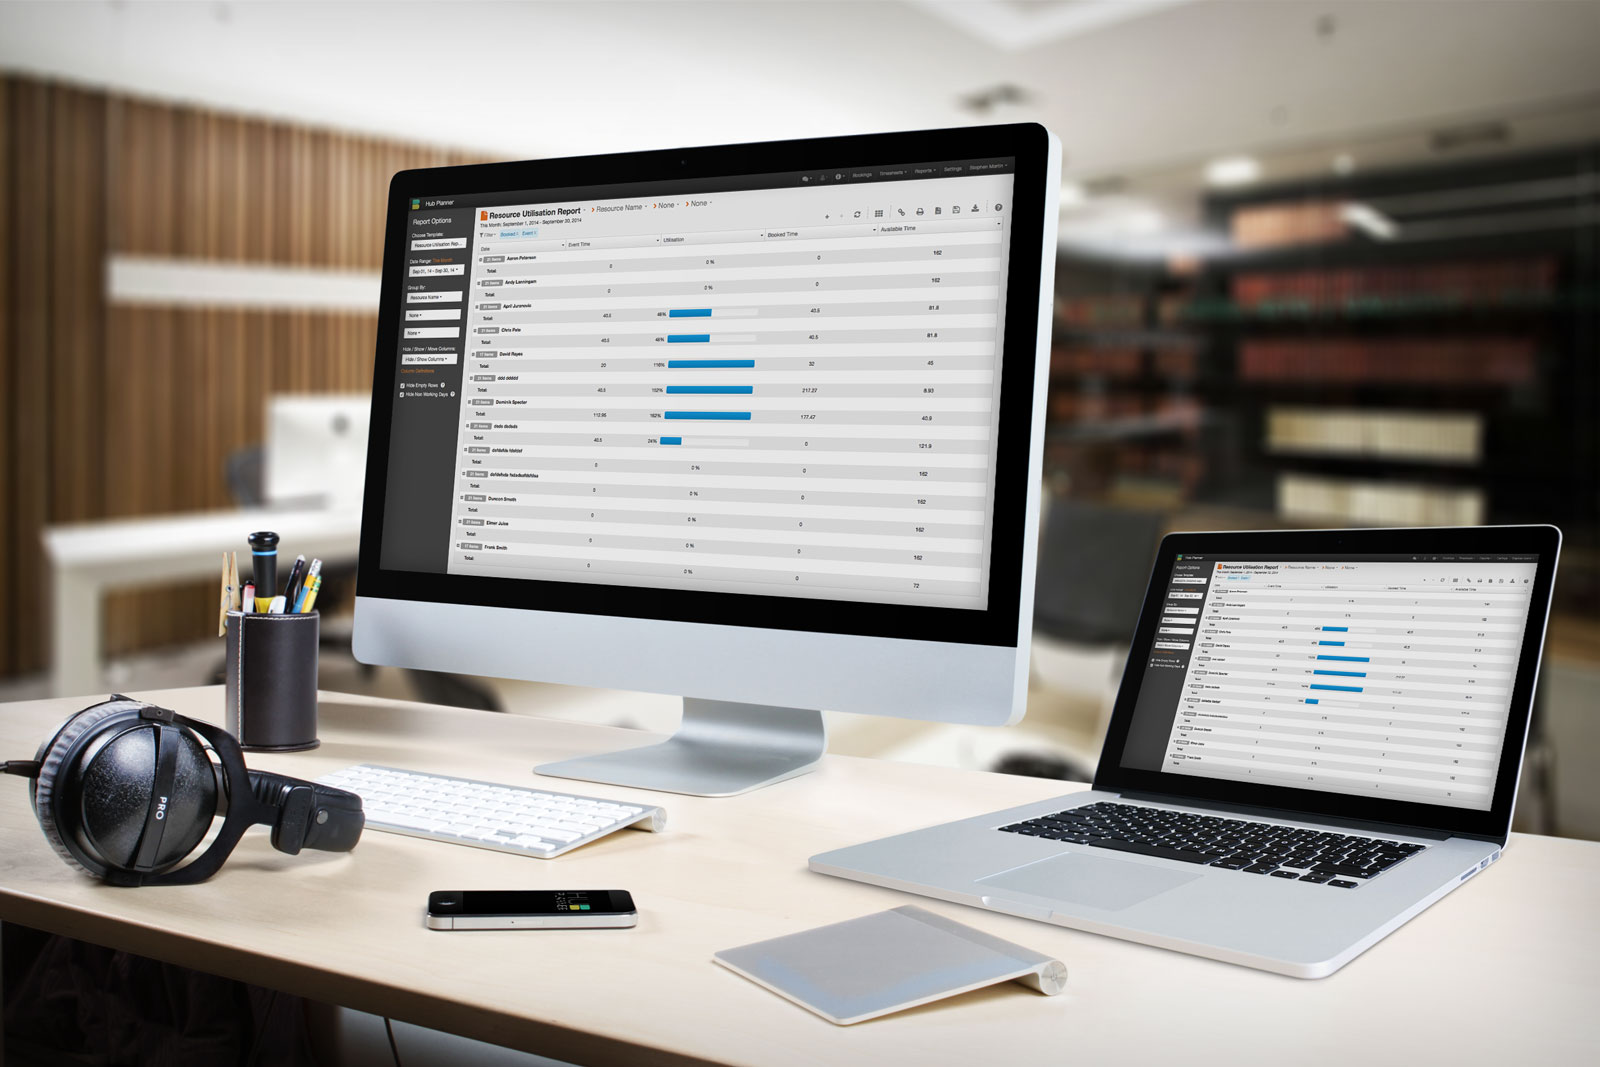
Hub Planner releases a new and slick dynamic report builder for generating complete resource, project, budget, progress, availability and utilisation reports. The new reports give you a lot more flexibility to cross reference the data you have inputted into the system to create meaningful reports for your business needs.
Dynamic
[/one-sixth]Group
[/one-sixth]Invoice
[/one-sixth]Export
[/one-sixth]Filter
[/one-sixth]Whats New?
The new reports has been re-written from the ground up and is packed full of reporting features every resource manager will find useful. Some of the reporting highlights include
- New Report Templates
- Create and Save your own Report Templates
- Smart Date Picker
- 3 levels of dynamic Grouping
- Hide / Show / Rearrange Columns of Data
- Breadcrumb for easy Filtering and Navigation
- Heatmap
- Print Ready
- Create Invoices
- Download & Export to CSV
- Grid Enhancements
- Increased Performance
New Report Templates
The new report templates in Hub Planner offer you much more depth than before. They are smartly grouped into different categories for easy navigation. You can now quickly view any event such as vacation or sick days as well as custom events you decide to add.
Customise and Save Report Templates
You can now save your resource planning templates by simply pressing the save button on a newly created template. You can always start with one of our base templates and then change the filtering, grouping or columns to make the report unique for your business.
The templates have a privacy setting and management module, so you can choose whether or not you want to share the report template with the rest of your team or just yourself.
Smart Date Picker
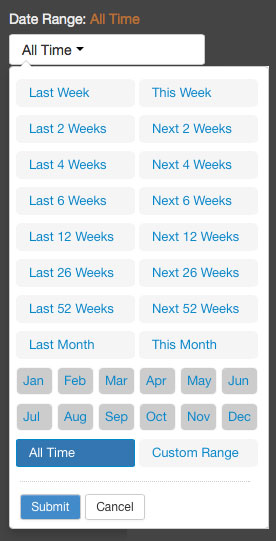
The date picker gives you many predefined options to dive right into set date ranges that could be useful for you as a business. The date ranges are set using today’s date and either looking weeks into the future or past. You can easily create your own custom date range too.
Dynamic Grouping
With the new Hub Planner reports you can group up to 3 levels of nested data into smart report groups. Each group is expandable on click or using the toolbar, so you can drill down to the individual line items you want to see for your report.
Hide / Show / Rearrange Columns
You have the ability to hide and show the columns quickly and easily. You can also easily drag and drop the columns to reposition them to the layout you wish to see the data presented. You can also filter out each column from the header.
Breadcrumb & Filtering
There are 2 breadcrumbs of data in the new report. The top breadcrumb is used to display the template you have chosen and then the grouping you are using. Clicking on any of the links in the breadcrumb will show you a new menu allowing you to switch up the template or group or allow you to smart filter on that particular item. The filtering breadcrumb is below the date and acts like a tag cloud. When filters are applied they will be displayed here. You can easily toggle on or off the filters or click and individual filter from the breadcrumb to remove it.
Report Heat Map
There is a heat map button with a color legend. Once turned on the heatmap will add a color box beside the numbers on a scale of 0 – 8+ . This can be useful sometimes to see the different colors of numbers you are looking at.
Print Ready
The reports are print ready, meaning you can now print these reports in a what you see is what you get fashion. If you create a report, with custom filters and grouping, the print box will print out exactly that layout. The new reports supports a vertical layout too which helps when printing large reports.
Create and Customize an Invoice
You can generate an invoice from any report. More information here.
Download & Export to CSV
Similar to the print feature you can download what you see in a CSV format. This is especially useful for creating Excel spreadsheets or charts with the data.
Grid Enhancements
The grid has come with several new links and enhancements so you can link directly to reports from other areas of the service. You can read more about it here.
Increased Performance
The back-end and front-end technology for Hub Planners reports has been completely re-written from the ground up making it a lot faster and much more performant to handle large data-sets than the the legacy reports.
We are very excited about this new resource planning reports feature. If you have any feedback, please let us know via the support dropdown once you are logged in.
Best,
Hub Planner Release Team

